
Sau bong bóng, nên đi đâu: Báo cáo phân tích thị trường tài sản kỹ thuật số năm 2026
Bong bóng tiền điện tử vỡ, tiền điện tử có thực sự chết? Lần này, chúng tôi chọn nghiên cứu bong bóng. Cho dù có thể câu trả lời đó sai thì đó cũng là sự chắc chắn của chính chúng ta.

Lời nói đầu: Sự chắc chắn và không chắc chắn của tiền điện tử
2026 Đầu năm mới trùng với một đợt chuyển đổi sang xu hướng tăng mới và toàn bộ thị trường đang vô cùng lo lắng. Sau năm 1011, toàn bộ thanh khoản thị trường bắt đầu cạn kiệt. Trong giai đoạn tiếp theo, ngoại trừ một số dự án và công ty hàng đầu vẫn còn tồn tại, còn nhiều đội chọn cách đóng cửa hoặc chuyển đổi.
Sau sự xuất hiện của Openclaw, một làn sóng công nghệ mới tràn qua và sự không chắc chắn to lớn khiến nỗi hoảng sợ của mọi người càng trở nên tồi tệ hơn. Trong khi thanh khoản thị trường sụt giảm, vô số công nhân tiền điện tử đã chọn chuyển sang AI. Các tổ chức truyền thông vốn chỉ tập trung vào tiền điện tử, cách đây một thời gian đã có nhiều báo cáo về AI xuất hiện trên các tiêu đề, thậm chí có cả những OG đã làm việc ở đây hơn mười năm. Hát “mã hóa đã chết”.
Bong bóng mã hóa vỡ, tiền điện tử có thực sự chết?
Hãy ném câu hỏi này cho AI, chúng có thể đưa ra vô số câu trả lời. DeepSeek sẽ cho bạn biết rằng cổ tức trên thị trường tiền điện tử đã tiêu tan và giờ đây nó là lĩnh vực của những người chơi tuân thủ chuyên nghiệp. Người bình thường không có cơ hội. Nếu bạn hỏi Grok, nó sẽ cho bạn biết rằng đó chỉ là một quá trình chuyển đổi theo hướng tăng giá của Crypto, điều này sẽ loại bỏ một nhóm người, nhưng cũng sẽ cho phép Crypto phát triển theo hướng tốt hơn. Nếu bạn hỏi lại Gemini, họ sẽ nói rằng sự phát triển của AI sẽ thúc đẩy sự phát triển đồng thời của Tiền điện tử.
Tiếng ồn quá lớn nên chúng tôi muốn tìm câu trả lời cho câu hỏi này theo cách riêng của mình. Không có gì mới dưới ánh mặt trời. Chúng ta vẫn còn những ký ức mơ hồ. Khi bong bóng Internet vừa vỡ vào năm 2001, thị trường cũng nói điều tương tự. Ngay cả mọi bong bóng, mọi người đều nói điều tương tự.
Vì vậy, lần này chúng tôi chọn nghiên cứu bong bóng.
Ngay cả khi câu trả lời có thể sai thì đây là điều chắc chắn của chúng tôi.
1. Khám phá quy luật của các chu kỳ lịch sử: Từ đường sắt đến Internet, bong bóng công nghệ thực hiện các chu kỳ lịch sử như thế nào

Vinh quang và đài phát thanh đường sắt: Những thăng trầm của cuộc cách mạng công nghiệp
Vào ngày 27 tháng 9 năm 1825, tuyến đường sắt đầu tiên trên thế giới được sản xuất tại Anh: Đường sắt Stockton-Darlington chính thức được thông xe. Ba năm trước, bất chấp sự phản đối của các quý tộc phong kiến và tôn giáo, các nhà tư bản đã nhìn thấy giá trị tương lai của gã khổng lồ thép này và chọn đặt cược vào nó và cuối cùng đã xây dựng được nó. Họ tin rằng công nghệ này sẽ mang lại lợi ích cho họ, nhưng họ không nhận ra tác động của nó đối với toàn bộ thời đại.
Tuy tuyến đường sắt đầu tiên chỉ được xây dựng như một nhánh của hệ thống giao thông kênh rạch nhưng nhờ sự tiện lợi và tiết kiệm chi phí nên toàn ngành bắt đầu mọc lên như nấm sau mưa và các nhà đầu tư cũng chọn tham gia. Vào cuối thời kỳ bong bóng đầu cơ khai khoáng ở Nam Mỹ năm 1824-1825, những nhà đầu tư mạo hiểm này bắt đầu chuyển sang kinh doanh đường sắt. Từ năm 1836 đến năm 1837, giá cổ phiếu của các công ty đường sắt tăng gấp đôi khi thị trường chứng khoán nói chung mạnh lên. Quốc hội Anh đã nhìn thấy cơ hội và phê duyệt thêm 44 công ty trong năm đó, và tổng số vốn huy động được bởi các công ty này trong năm dễ dàng vượt quá tất cả nguồn tài trợ trước đó trong ngành cộng lại.
Sự trỗi dậy, tiêu tan và tái xuất hiện của bong bóng
Giống như vô số bong bóng ở các thế hệ sau, khi một công nghệ mới dần được thị trường thừa nhận, nó sẽ phát triển nhanh chóng trong thời gian ngắn và bùng nổ nhanh chóng. Sau đó, khi cơ sở hạ tầng dần được cải thiện, một đợt bong bóng mới sẽ trở nên mạnh mẽ hơn và cuối cùng sẽ quay trở lại đúng hướng.
Sau khi thành lập 44 công ty này, do mạng lưới đường sắt hoàn chỉnh vẫn chưa được xây dựng nên giao thông đường sắt vào thời điểm này dường như không thuận tiện như vận tải đường thủy truyền thống và chỉ số giá cổ phiếu đường sắt bắt đầu giảm trong giai đoạn này. Đến đầu những năm 1940, giá trị bắt đầu tăng trở lại và gần đạt mức đỉnh trước đó. Vốn đầu tư trung bình hàng năm vào các công ty đường sắt trước năm 1843 là khoảng 1 triệu bảng Anh (khoảng 3,5 tỷ USD ngày nay), tăng lên 20 triệu bảng Anh (20x) vào năm 1844, gần 60 triệu bảng Anh (60x) vào năm 1845 và 132 triệu bảng Anh (tương đương 1.200 USD ngày nay) vào năm 1846 tỷ), cùng năm đó, tổng chiều dài của các tuyến đường sắt mới cũng đạt kỷ lục 4.538 dặm. Mọi thứ có vẻ thịnh vượng.
Sự vỡ bong bóng và giá trị trở lại
Không thể phủ nhận rằng đường sắt thời kỳ đầu thực sự là những dự án kinh doanh thành công, nhưng do sự lạc quan của nhà đầu tư nên giá cổ phiếu đã sớm vượt mức cao nhất mà cổ phiếu đường sắt có thể đạt được trong điều kiện định giá hợp lý. Những tuyến đường sắt đầu tiên có lợi thế của người đi đầu, nhưng nếu không có rào cản gia nhập thì lợi thế này sẽ không còn tồn tại. Vốn thị trường đủ kết hợp với ngưỡng công nghệ/thị trường thấp là cơ hội tuyệt vời cho các đối thủ cạnh tranh tiếp theo. Điều này cũng sẽ dẫn đến việc liên tục giảm tỷ suất lợi nhuận của các công ty ban đầu, cuối cùng hình thành một môi trường trong đó tỷ suất lợi nhuận của toàn ngành tiếp tục giảm, thường được gọi là "sự xâm nhập".
Đối với các nhà đầu tư thị trường vào thời điểm này, dấu hiệu đầu tiên cho thấy sự bùng nổ sắp kết thúc là sự biến mất của mức phí bảo hiểm khổng lồ đối với các cổ phiếu mới phát hành và chỉ những công ty được coi là có chất lượng cao hơn mới có thể duy trì giá cổ phiếu của mình. Đối với các công ty đường sắt vẫn đang tồn tại vào thời điểm này, việc mở rộng và chiếm giữ nguồn tài nguyên đất chất lượng cao chắc chắn là lựa chọn tốt nhất để duy trì giá trị doanh nghiệp và lợi thế cạnh tranh. Sử dụng vốn vay ngân hàng làm đòn bẩy có thể đẩy nhanh lợi thế này. Tệ hơn nữa, vì họ thuộc một ngành công nghiệp mới nổi nên hầu hết các công ty đường sắt sẽ luôn đánh giá thấp độ khó của việc xây dựng đường sắt trong tiềm thức, điều này khiến chi phí thực tế của việc xây dựng đường sắt vượt xa ước tính ban đầu trong bản cáo bạch. Theo thời gian, các cổ phiếu doanh nghiệp này đã biến thành trò chơi tài chính hoàn toàn: cổ tức của các công ty đường sắt không còn đến từ lợi nhuận doanh nghiệp mà từ các quỹ vốn và các khoản vay ngân hàng.
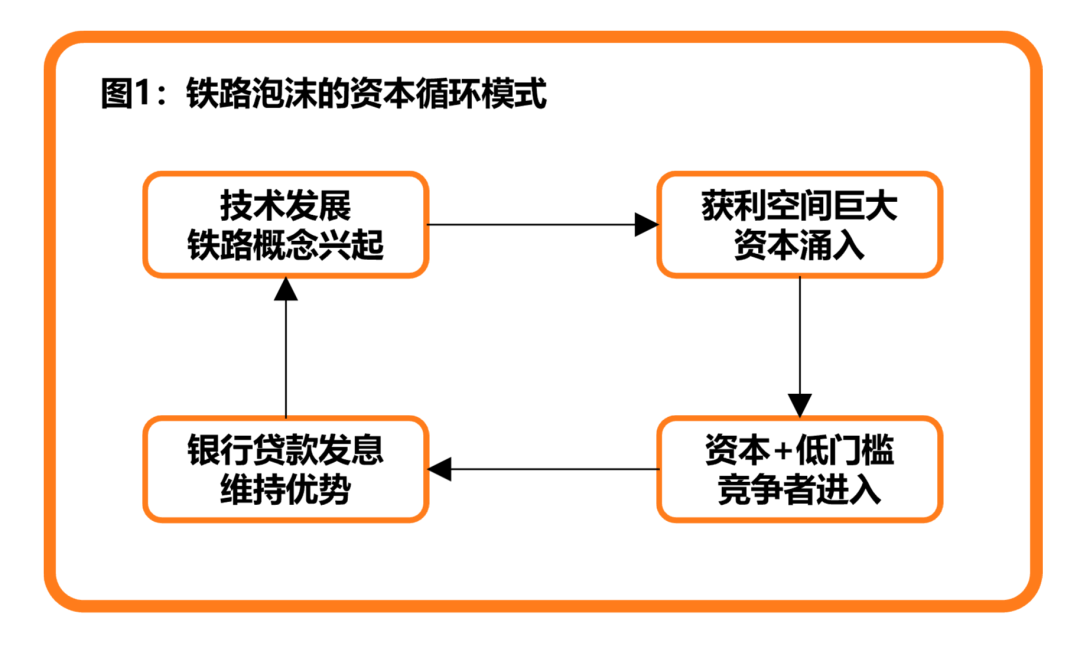
Dưới một bánh đà luẩn quẩn như vậy, lãi suất ngân hàng liên tục tăng. Sau một điểm tới hạn nhất định, các công ty đường sắt không thể tiếp tục chu kỳ vốn này nữa, và nguồn vốn tỏa sáng do công nghệ mang lại đột nhiên tiêu tan. Chỉ sau một đêm, vô số nhà đầu tư đã phá sản, và công chúng khen ngợi các công ty đường sắt chuyển sang chỉ trích.
Trước tình hình này, chính phủ Anh buộc phải thông qua dự luật của quốc hội cho phép ngành đường sắt được củng cố và bỏ gần 20% số tuyến đường sắt mới đã được phê duyệt xây dựng. Khi các công ty còn sống sót lấy lại được lợi nhuận, một làn sóng mua bán và sáp nhập bắt đầu. Sau đó, ánh hào quang của ngành đường sắt nước Anh không còn là sự hiện diện chói lọi mà giống như những tia nắng sớm mai chiếu nhẹ nhàng, chậm rãi trên vùng đất này. Mặc dù những bong bóng vốn điên rồ đó rất khó tái tạo nhưng chúng thực sự đã nuôi dưỡng sự phát triển của Cách mạng Công nghiệp.
Cuối cùng, câu chuyện tương tự lại xảy ra ở lục địa Mỹ sau đó ít lâu.
Marconi và Radio
Như một chú thích cuối trang cho sự phát triển của thời đại, câu chuyện về tuyến đường sắt đã đi đến hồi kết. Với sự phát triển không ngừng của giao thông vận tải, khoảng cách giữa thế giới đang dần được thu hẹp. Mọi người có thể sử dụng những phương tiện này để đi đến những nơi xa xôi, hoặc sử dụng các cuộc gọi có dây và điện báo để truyền tải thông tin mà không cần rời khỏi nhà.
Tất nhiên, giới hạn tốc độ truyền thông tin phải nhiều hơn thế này.
Sau khi nhà vật lý người Scotland Maxwell đề xuất một cách có hệ thống lý thuyết sóng điện từ vào năm 1865, một số nhà phát minh bắt đầu thử nghiệm nhiều thí nghiệm sóng vô tuyến khác nhau. Cuối cùng, vào năm 1895, nữ thần may mắn đã ưu ái Guglielmo Marconi, một nhà phát minh đến từ Ý. Khi chế tạo thành công máy thu rung chuông ở khoảng cách 10 thước thông qua máy phát tín hiệu tự phát triển, ông tin rằng khoảng cách có thể xa hơn.
Marconi nhạy bén phát hiện ra giá trị thương mại trong tương lai của công nghệ này nên ông đã nộp đơn xin cấp bằng sáng chế vào năm 1896 và bắt đầu quảng bá công nghệ của mình cho các cơ quan chính phủ. Ngay sau đó, ông thành lập Công ty Tín hiệu và Điện báo Không dây để phát triển và bán thiết bị điện báo không dây này. Để đổi lấy việc từ bỏ quyền sáng chế, Marconi nhận được 15.000 bảng Anh (tương đương 6 triệu USD ngày nay) tiền mặt và 60.000 bảng Anh (tương đương 28 triệu USD ngày nay) cổ phiếu, giúp Marconi thoát khỏi những lo lắng về tài chính. Năm nay Marconi mới 22 tuổi.
Từ chiến tranh đến thị trường
Là một ngôi sao đang lên, Marconi nhanh chóng thu hút sự chú ý từ mọi tầng lớp xã hội. Trong những ngày đầu thành lập công ty, Marconi đã nắm bắt được nhu cầu liên lạc toàn cầu của Hải quân Anh vào thời điểm đó, và vào năm 1899 đã cung cấp dịch vụ tư vấn và bán thiết bị vô tuyến cho hải quân Anh và Ý. Đơn đặt hàng đầu tiên có giá 6.000 bảng Anh (tương đương 2,5 triệu USD ngày nay), với doanh thu hàng năm sau đó vượt quá 3.000 bảng Anh (tương đương 1,25 triệu USD ngày nay).
Mặc dù đã nhận được sự ủng hộ chứng thực hợp tác cấp quốc gia nhưng thị trường vẫn còn hoài nghi về việc liệu công nghệ này có thể đạt được giá trị thương mại thông thường hay không. Sau nhiều năm thử nghiệm và sai sót, Marconi đã điều chỉnh mô hình kinh doanh của mình, chuyển chiến lược bán hàng từ bán hàng trực tiếp sang cho thuê. So với con đường truyền thống, đặc điểm lớn nhất của phương pháp này là xây dựng sinh thái. Thông qua sự hợp tác như vậy, ông cho phép bất kỳ sản phẩm hoặc doanh nghiệp nào sử dụng sản phẩm radio với một khoản phí thuê một phần, với hạn chế duy nhất là tất cả khách hàng chỉ có thể liên lạc với những khách hàng khác của Marconi.
Chính chiến lược này đã sinh ra vô số đài phát thanh và những đối thủ cạnh tranh tương tự.
Sự ra đời của cổ phiếu ý tưởng radio
Với sự bổ sung của Marconi và các đối thủ cạnh tranh công nghệ khác, toàn bộ ngành phát thanh bắt đầu phát triển mạnh và vô số vốn đổ vào đó. Trong những ngày đầu của Marconi, mặc dù báo cáo tài chính của công ty cho thấy lỗ nhưng điều này không ngăn cản được sự nhiệt tình của các nhà đầu tư: công nghệ và mô hình kinh doanh vẫn đang trong giai đoạn phát triển ban đầu và việc thua lỗ là không thể chấp nhận được. Sau đó, Marconi đổi tên thành RCA, lợi thế kỹ thuật và mạng lưới kinh doanh mà công ty tích lũy được ở Hoa Kỳ bắt đầu bộc lộ giá trị vào thời điểm này. Kết hợp các bằng sáng chế thuộc sở hữu của AT&T, GE, RCA và Westinghouse Electric, họ đã tạo thành một pháo đài kinh doanh không thể xuyên thủng, dẫn tới sự tăng trưởng bùng nổ về doanh thu và lợi nhuận của RCA.
Câu chuyện sau đó cũng giống hệt câu chuyện chia cổ tức đường sắt trước đó: vô số vốn và công ty đổ vào theo cổ tức. Khi cổ tức bắt đầu giảm dần, các khoản vay ngân hàng bắt đầu được chia thành cổ tức. Cuối cùng, thị trường sụp đổ và cổ tức biến mất. Khác với đường sắt, giá trị thương mại của công nghệ vô tuyến mang tính thời đại đến mức sự bùng nổ công nghệ này kéo dài gần hai thập kỷ. Khi cơ sở hạ tầng phát thanh hoàn thiện, từ đài phát thanh đến truyền hình, truyền thanh, không gian tưởng tượng đủ lớn để giữ cho thị trường ở mức thịnh vượng trong một thời gian dài.
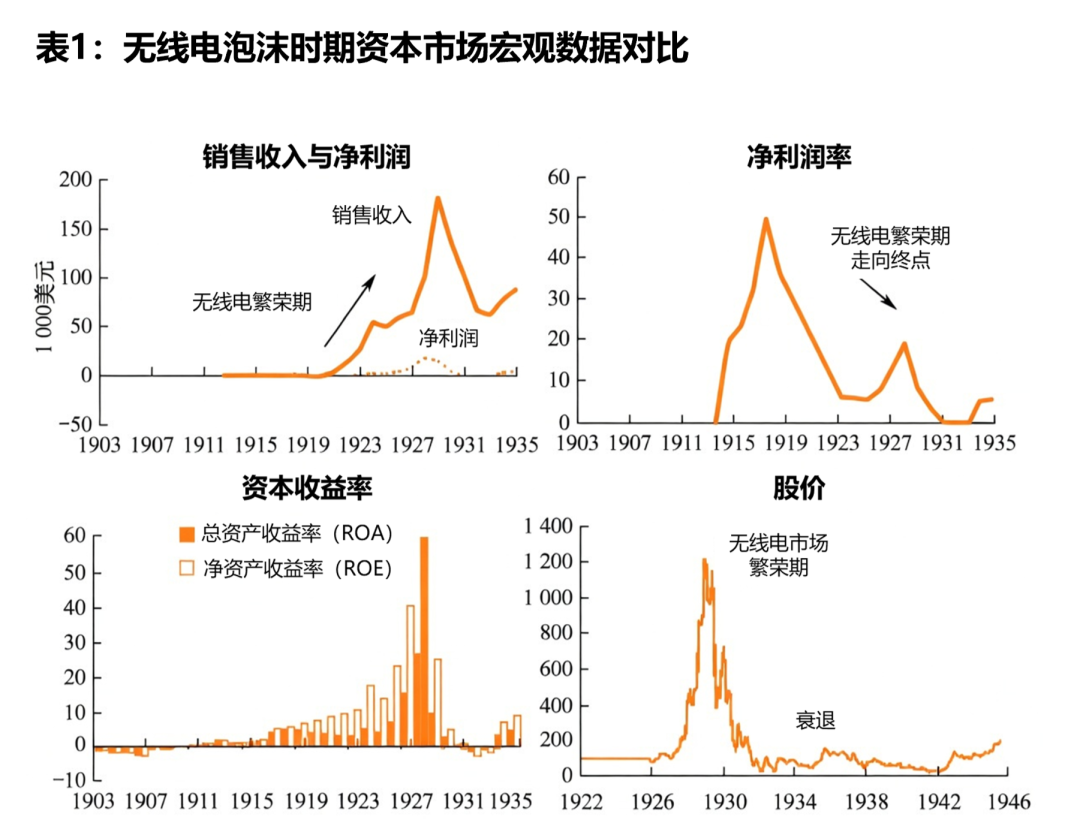
Cuối cùng, với Cuộc Đại suy thoái xảy ra, trò chơi vốn không thể tiếp tục được nữa và mọi người phải tìm kiếm những phương tiện khó khăn hơn nhưng thiết thực hơn để tăng doanh thu bán hàng thực tế và lợi nhuận ròng của công ty và sản phẩm.
Đỉnh của làn sóng Internet: một vòng thử nghiệm xã hội công nghệ mới
Sau khi IBM cố gắng phát triển máy tính cá nhân và được Apple tiếp sức, tỷ lệ thâm nhập của máy tính vào thị trường đại chúng đã đạt đến một tầm cao mới và điều này cũng có nghĩa là một số công nghệ vốn chỉ tồn tại trong các phòng thí nghiệm nghiên cứu khoa học bắt đầu xuất hiện - Internet.
Từ tháp ngà đến lĩnh vực thương mại
Nguồn gốc và sự ra đời của Internet đã trở thành một chủ đề phổ biến và sẽ không được nhắc lại ở đây. So với sự ra đời của nó, hành trình Internet hướng tới thương mại hóa rõ ràng đáng để chúng ta nghiên cứu hơn.
Điều đóng vai trò quyết định trong quá trình chuyển đổi này là quyết định của Quỹ Khoa học Quốc gia (NSF) từ bỏ quyền kiểm soát Mạng lưới Nghiên cứu Giáo dục và Nghiên cứu Quốc gia (NREN) và quyết định chuyển nó thành một hoạt động tư nhân hóa và tư lợi. Trong quá trình này, vô số yếu tố then chốt đã xuất hiện để biến Internet thành ứng dụng rộng khắp cho xã hội: Apple PC cung cấp nền tảng phần cứng, World Wide Web cung cấp khuôn khổ và Khảm cung cấp điểm truy cập. Cùng với sự chuyển đổi thương mại của NREN, một ngành công nghiệp khổng lồ đã bắt đầu cuộc sống huy hoàng của nó.
Trong những ngày đầu của nguồn mở thương mại, không phải ai cũng nhìn thấy cơ hội này và ngày càng có nhiều công ty liên quan chọn cách tiếp cận bảo thủ. Một mặt, kho kiến thức và hiểu biết sâu sắc của họ không cho phép họ nhận ra những cơ hội tiềm ẩn có trên Internet; mặt khác, trong môi trường kinh doanh lúc bấy giờ, các ông lớn trong ngành hầu hết tạo ra doanh thu cho mình bằng cách tranh giành đất đai, xây dựng hệ sinh thái của riêng mình. Đối mặt với môi trường mới cực kỳ rộng mở này, bọn họ đương nhiên phải bị đẩy lùi. Tuy nhiên, đây không phải là điều xấu đối với sự phát triển của ngành: sự phản kháng của những gã khổng lồ mang lại không gian thị trường và cơ hội rộng rãi cho những người mới gia nhập.
Netscape: Người đầu tiên ăn cua
Là một trong những công ty đầu tiên ăn cua, thời kỳ đỉnh cao của Netscape thực sự gây chấn động toàn thị trường. Vào cuối năm 1994, Khảm Truyền thông bị lôi kéo vào một vụ tranh chấp pháp lý do có cùng tên với Khảm, và cuối cùng nó được đổi tên thành Netscape Communications Hợp tác.
Mặc dù sổ sách của công ty vào thời điểm này vẫn còn 12 triệu đô la Mỹ, nhưng khoản chi tiền mặt hàng tháng là 1 triệu đô la Mỹ vẫn buộc Netscape phải xem xét việc chuyển đổi mô hình kinh doanh của mình. Sau một số hoạt động, nó đã thay đổi mô hình dịch vụ trước đó và nhanh chóng chiếm lĩnh một số lượng lớn thị trường thông qua thời gian dùng thử miễn phí 30 ngày + phí dịch vụ tiếp theo là 49 đô la Mỹ. Kết hợp với những lợi thế vượt trội về hiệu suất sản phẩm, nó nhanh chóng chiếm lĩnh một số lượng lớn thị trường. Mục đích ban đầu của nó chỉ là sử dụng tỷ giá thị trường để làm cho việc định giá thị trường của nó có vẻ tốt hơn. Tôi chưa bao giờ nghĩ rằng thủ thuật này lại quá dễ sử dụng. Trong đợt IPO vào tháng 8 năm 1995, Netscape đã huy động được 140 triệu đô la Mỹ từ quỹ công, đưa Netscape trực tiếp lên đỉnh cao.
Tuy nhiên, thành công cũng tệ như thất bại. Thành công của chiến lược bán hàng này khiến Netscape cảm thấy phấn chấn. Trong khi tận hưởng niềm vui của đợt IPO, nó đã không tính đến việc tiếp theo sẽ xây dựng con hào riêng của mình như thế nào. Họ không ổn định được các con hào thượng nguồn và hạ nguồn thông qua việc mua lại công ty, cũng như không phát triển sâu hơn các sản phẩm của mình để khiến chúng trở nên hữu ích hơn. Thậm chí, họ còn bác bỏ việc hợp tác kinh doanh với ngành mà chọn phương án ngu ngốc nhất là đứng yên.
Cuối cùng, kết quả của nó cũng rất rõ ràng - khi thị trường phát hiện ra chiếc bánh khổng lồ này, và độ ngon của nó đã được Netscape, người tiên phong, kiểm chứng, thì một số lượng lớn đối thủ cạnh tranh đã đổ vào đó, và Netscape cuối cùng đã bị AOL mua lại.
Khi cá voi rơi xuống, mọi thứ trở nên sống động
Câu chuyện của Netscape tuy buồn nhưng nhìn chung là một điều có ý nghĩa đối với sự phát triển của thị trường. Vô số người tìm kiếm lợi nhuận và những người đổi mới đã tham gia cuộc phiêu lưu này và nhiều dự án rực rỡ đã ra đời từ đó. Gần như cùng năm Netscape trở nên thành công, Jerry Yang và David Filo đã dành nhiều thời gian nghiên cứu nhu cầu của trình duyệt và cuối cùng đã hoàn thành một hệ thống chỉ mục thông tin cực kỳ hiệu quả. Họ đặt tên cho hệ thống này là "Yahoo". Sergey Brin và Larry Page tại Đại học Stanford đã cố gắng khám phá các công cụ tìm kiếm thông tin và cách tìm thông tin họ muốn nhanh hơn trên Internet. Khi những ý tưởng này lan truyền khắp đại dương, Jack Ma đã được truyền cảm hứng và bắt đầu chuẩn bị cho việc phát triển và xây dựng “Những trang vàng Trung Quốc”.
Bong bóng khái niệm cuối cùng
So với công nghệ đường sắt và công nghệ vô tuyến trước đây, công nghệ Internet rõ ràng có rào cản gia nhập thấp hơn. Nó không yêu cầu chúng tôi thuê công nhân để xây dựng cáp mạng lưới đường sắt, cũng như không yêu cầu chính phủ phải có được các bằng cấp tiếp cận liên quan. Chỉ cần bạn hiểu những kiến thức liên quan về Internet, bạn có thể làm bất cứ điều gì bạn muốn trong đó. Hiệu ứng tài sản khổng lồ kết hợp với ngưỡng đầu vào thấp đã bắt đầu một lễ hội trên thị trường vốn.
Khi bong bóng mới bắt đầu, thị trường vốn vẫn sẽ duy trì mức độ thận trọng nhất định. Tuy nhiên, khi họ thấy những sản phẩm đơn giản như Yahoo và Google, vốn ra đời trong "gara", cũng có thể kiếm được rất nhiều tiền thông qua các mô hình kinh doanh tiên tiến, họ nhận ra rằng logic định giá thị trường ban đầu dường như đang bắt đầu thất bại. Ngoài ra, giá của nhiều cổ phiếu công nghệ Internet khác nhau đang tăng lên nhanh chóng và các nhà đầu tư đã vứt bỏ những nghi ngờ trước đó của họ từ lâu. Cuối cùng, đối với các nhà đầu tư cơ bản, việc định giá trong ngành TMT đã bị thổi phồng một cách giả tạo một cách không biện hộ và bừa bãi, và hầu hết mọi người đều đồng ý rằng điều này không có gì sai.
Khi việc định giá doanh nghiệp có xu hướng trở nên táo bạo hơn, các tiêu chuẩn phân tích chuyên nghiệp cũng bắt đầu biến dạng. Nói chung, giá cổ phiếu càng cao thì các nhà phân tích dựa trên báo cáo thu nhập sẽ có xu hướng đưa ra định giá cao hơn. Để đảm bảo tính hợp lý của việc định giá, khi mỏ neo lợi nhuận ban đầu không còn có thể hỗ trợ mức giá hiện tại, tiêu chuẩn định giá sẽ dần dần chuyển từ lợi nhuận sang doanh thu, sau đó dần dần tách doanh thu thành các khái niệm như "tỷ lệ nhấp chuột" và "tỷ lệ duy trì" và sử dụng điều này để phân tích triển vọng thị trường của công ty trong vài năm tới. Toàn bộ logic đều hợp lý, nhưng điểm tai hại nhất là trong trường hợp không có tài liệu tham khảo từ các trường hợp trong quá khứ, cách duy nhất để đảm bảo tính hợp lệ của việc phân tích mô hình kinh doanh là lắng nghe phân tích của nhóm sáng lập, tức là “kể chuyện”.
Cuối cùng, mọi người không còn nữa trả tiền cho tính thực tế của công nghệ, nhưng chọn trả tiền cho câu chuyện - bất kỳ ai có câu chuyện kinh doanh thuyết phục hơn và triển vọng rộng hơn đều có khả năng huy động được nhiều vốn hơn. Một FOMO thực sự đã bắt đầu. Lúc đầu, mọi người vẫn làm công việc thiết kế kinh doanh một cách nghiêm túc. Tuy nhiên, khi thị trường ngày càng trở nên sôi động, một số người phát hiện ra rằng ngay cả khi hoạt động kinh doanh của họ không liên quan gì đến Internet, chỉ cần họ đăng ký một trang web, họ có thể được xếp vào ngành TMT và được hưởng cổ tức thị trường. Không thể phủ nhận rằng một số dự án cực kỳ hướng tới tương lai đã xuất hiện trong hội nghị câu chuyện này, chẳng hạn như mua sắm trực tuyến, mang về trực tuyến và thậm chí cả chăm sóc thú cưng trực tuyến. Tuy nhiên, vấn đề là khi cơ sở hạ tầng chưa hoàn thiện thì câu chuyện cũng chỉ là câu chuyện.
Cuối cùng, cái kết tương tự lại xảy ra. Đối với những công ty trên thị trường chứng khoán, không có nhiều công ty thực sự thích ứng được với thời đại và trụ lại được. Hầu hết họ đều dựa vào các khoản vay ngân hàng để duy trì sự thịnh vượng giả tạo này cho đến khi lãi suất ngân hàng đạt đến một điểm tới hạn nhất định và thị trường sụp đổ.
Chỉ báo bong bóng dựa trên dữ liệu: Việc định giá Internet thất bại như thế nào
Những câu chuyện lịch sử được kể một cách đơn giản nhưng nếu muốn khám phá thêm thông tin có giá trị, chúng ta cần chuyển những câu chuyện này thành các chỉ báo tài chính vĩ mô có thể định lượng và có thể so sánh được, đồng thời tìm ra các mô hình từ chúng. Phần này lấy bong bóng Internet (1995–2002) làm mẫu cốt lõi, được bổ sung bằng dữ liệu lịch sử trước và sau cuộc Đại suy thoái năm 1929 làm tài liệu tham khảo và trình bày một cách có hệ thống đường phát triển của dữ liệu vĩ mô trong vòng đời bong bóng từ bốn chiều—chỉ số định giá, môi trường tiền tệ, dòng vốn và nền kinh tế thực. Những xu hướng thay đổi thường xuyên này sẽ cung cấp một chuẩn mực “bất biến” vững chắc cho việc phân tích theo chu kỳ của thị trường Tiền điện tử trong các chương tiếp theo.
Lạm phát cực độ của tỷ lệ giá trên thu nhập (Tỷ lệ P/E)
Tín hiệu trực quan nhất về bong bóng được phản ánh trong các chỉ báo định giá. Trong mọi bong bóng công nghệ, kỳ vọng lạc quan của thị trường đối với công nghệ mới dần dần đẩy hệ số định giá lên cao hơn cho đến khi chúng tách rời khỏi bất kỳ cơ sở cơ bản hợp lý nào. Quá trình này là một quá trình "trôi neo" lũy tiến, trong đó các nhà đầu tư dần dần chấp nhận mức định giá ngày càng quá cao cho đến khi toàn bộ hệ thống định giá thất bại.
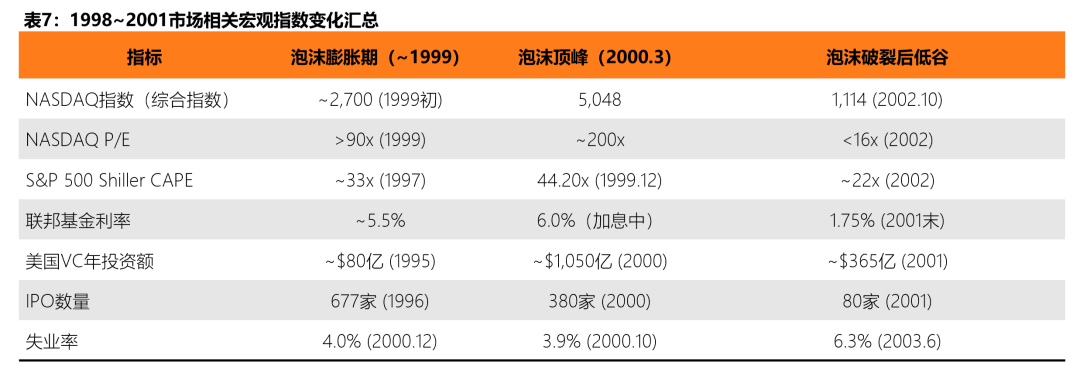
Trong thời kỳ bong bóng Internet, tỷ lệ giá trên thu nhập của Chỉ số tổng hợp NASDAQ đã tăng vọt lên khoảng 200 lần vào thời kỳ đỉnh cao vào tháng 3 năm 2000, vượt xa mức đỉnh 60-80 lần của Nikkei 225 trong thời kỳ bong bóng tài sản ở Nhật Bản. Con số này có nghĩa là các nhà đầu tư sẵn sàng trả 200 USD cho mỗi 1 USD thu nhập hiện tại - nói cách khác, các nhà đầu tư sẽ phải mất 200 năm để bù đắp chi phí ngay cả khi thu nhập của công ty không tăng chút nào. Điều đáng chú ý hơn là hơn một nửa số công ty công nghệ niêm yết trên NASDAQ đang thua lỗ ở đỉnh điểm của bong bóng và không thể tính được giá trị P/E có ý nghĩa.
Trong khi đó, S&P 500 ở khoảng ~29–33x trong giai đoạn 1999–2000, với nhiều chỉ số trên 45x xảy ra vào khoảng năm 2002—trong khi mức trung bình lịch sử dài hạn của nó chỉ ở khoảng 15–20x. P/E của chỉ số NASDAQ vẫn cao tới 175 lần vào tháng 3 năm 2001, cho thấy ngay cả khi bong bóng đã bắt đầu vỡ thì việc quay trở lại giá trị thị trường vẫn chưa hoàn tất.
Tỷ lệ Shiller CAPE: Cảnh báo định giá xuyên thế kỷ
Tỷ lệ giá trên thu nhập được điều chỉnh theo chu kỳ (CAPE, còn được gọi là Shiller P/E hoặc P/E 10) do người đoạt giải Nobel Robert Shiller phát triển sử dụng thu nhập trung bình được điều chỉnh theo lạm phát trong 10 năm qua để làm dịu đi những biến động ngắn hạn và được nhiều người coi là một trong những chỉ số đáng tin cậy nhất của mức định giá dài hạn của thị trường. Trong hơn 140 năm dữ liệu lịch sử từ năm 1881 đến nay, CAPE của S&P 500 có CAPE trung bình là 16,04x và trung bình khoảng 17,17x.
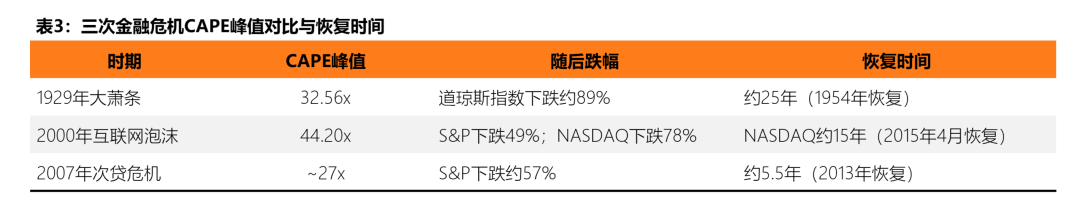
Tại ba thời điểm bong bóng mang tính biểu tượng, CAPE đã vượt đáng kể "ngưỡng nguy hiểm" 30 lần: 32,56 lần vào năm 1929 trước cuộc Đại suy thoái, tiếp theo là thị trường sụp đổ 89% và chỉ số này không phục hồi hoàn toàn cho đến năm 1954; và kỷ lục 44,20 lần trong thời kỳ bong bóng Internet năm 2000, sau đó là S&P 500. Sau khi giảm 49% từ năm 2000–2002, NASDAQ giảm 78% và các nhà đầu tư chỉ nhận được lợi nhuận thực tế hàng năm khoảng -1,4% trong thập kỷ từ 2000–2010. Dữ liệu lịch sử cho thấy rằng khi CAPE vượt quá 30 lần, lợi nhuận thực tế hàng năm trong thập kỷ tiếp theo trung bình chỉ là 0–3%, thấp hơn nhiều so với mức trung bình dài hạn khoảng 7%.
Điều quan trọng cần lưu ý rằng CAPE không phải là “công cụ tính thời gian” – CAPE cao không thể dự đoán khi nào sự cố sẽ xảy ra, nhưng nó cực kỳ hiệu quả trong việc dự đoán một loạt lợi nhuận thấp trong thập kỷ tới. Như Ngân hàng Dự trữ Liên bang Minneapolis đã chỉ ra trong báo cáo nghiên cứu của mình, mặc dù tác động đến nền kinh tế thực sau vụ nổ bong bóng công nghệ năm 2000 là tương đối nhẹ nhưng sự tàn phá tài sản của các nhà đầu tư trên thị trường chứng khoán là rất sâu sắc.
Sự khác biệt cực độ về tỷ lệ giá trên doanh thu (P/S)
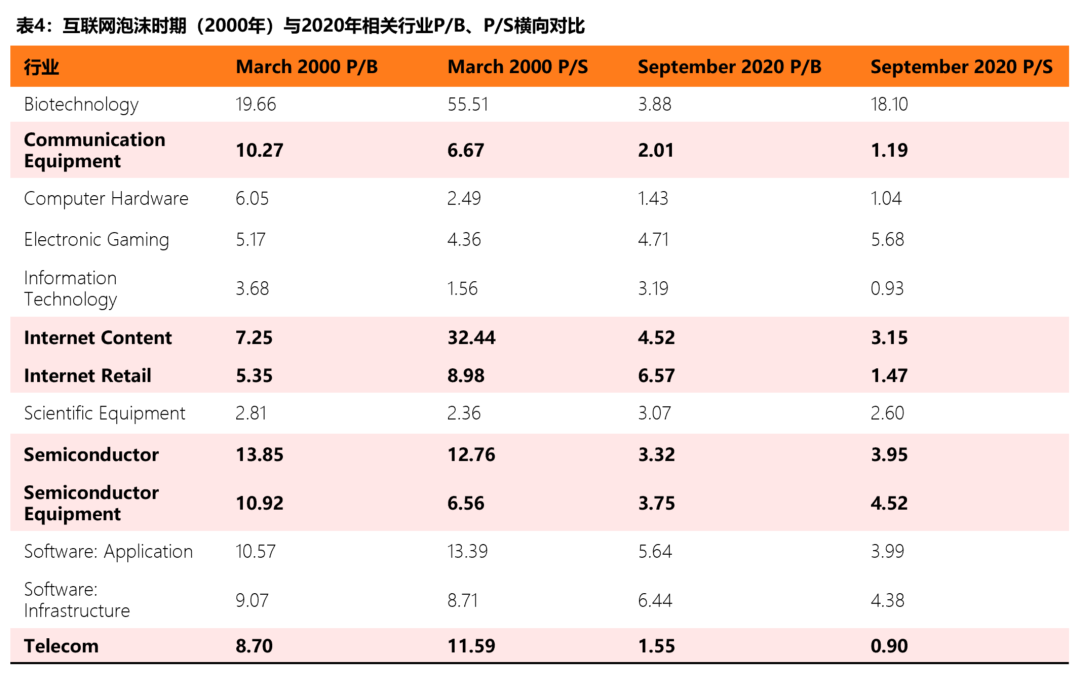
Do một số lượng lớn công ty niêm yết thua lỗ ở đỉnh cao của bong bóng (hơn một nửa số công ty công nghệ niêm yết trên NASDAQ không có lợi nhuận dương vào tháng 3 năm 2000) nên tỷ lệ P/E thực sự đã mất giá trị tham chiếu. Do đó, tỷ lệ giá trên doanh thu (P/S) trở thành một chỉ báo đáng tin cậy hơn về mức độ nghiêm trọng của bong bóng.
Nghiên cứu của Viện CFA cho thấy P/S trung bình của các công ty trong danh mục "Nội dung Internet" đạt 32,44 lần vào tháng 3 năm 2000, trong khi P/S trung bình của các công ty cùng danh mục vào tháng 9 năm 2020 chỉ là 3,15 lần - chênh lệch hơn 10 lần. Tỷ lệ giá trên giá trị sổ sách (P/B) trung bình của ngành bán dẫn cũng giảm từ 13,85 lần năm 2000 xuống 3,32 lần vào năm 2020.
Con dao hai lưỡi của chính sách tiền tệ: Nới lỏng tạo ra bong bóng, đồng thời thắt chặt chọc thủng bong bóng
Đằng sau mỗi bong bóng tài sản quy mô lớn, gần như có thể tìm thấy chính sách tiền tệ lỏng lẻo. Mức lãi suất quyết định “chi phí cơ hội” của vốn. Khi tỷ suất lợi nhuận phi rủi ro cực kỳ thấp, vốn sẽ tự nhiên chảy vào các tài sản có rủi ro cao và lợi nhuận cao, tạo ra mảnh đất màu mỡ nhất cho hoạt động đầu cơ. Khi ngân hàng trung ương chuyển sang thắt chặt và tăng lãi suất để tăng chi phí vốn, nguy cơ bong bóng sẽ lộ rõ.
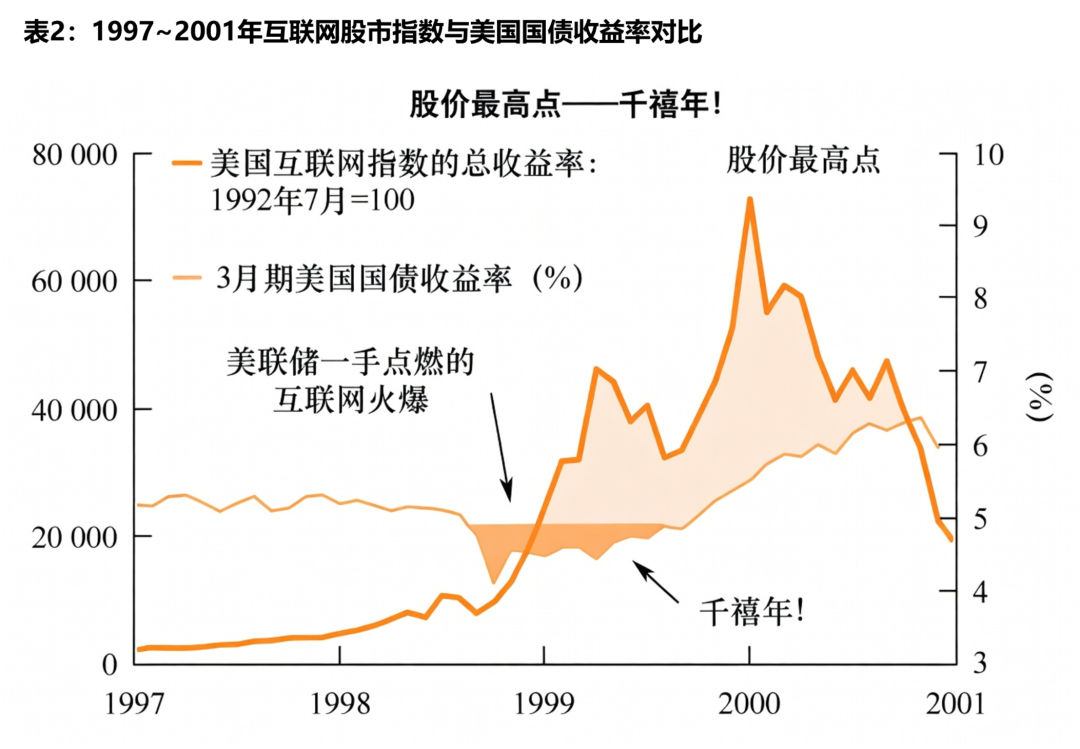
Chu kỳ nới lỏng: chất xúc tác cho bong bóng. Bối cảnh chính sách tiền tệ cho bong bóng dot-com bắt đầu vào giữa những năm 1990. Từ năm 1995 đến năm 1998, Cục Dự trữ Liên bang, dưới sự lãnh đạo của Alan Greenspan, đã duy trì một môi trường lãi suất tương đối lỏng lẻo, với lãi suất quỹ liên bang được duy trì ở mức xấp xỉ 5,25–5,5%. Quan trọng hơn, vào mùa thu năm 1998, sự sụp đổ của quỹ phòng hộ Quản lý vốn dài hạn (LTCM) đã gây ra những lo ngại về rủi ro hệ thống và Cục Dự trữ Liên bang đã cắt giảm lãi suất ba lần liên tiếp, từ 5,5% xuống 4,75%. Khi Goldman Sachs xem xét lại giai đoạn này, có thể thấy rõ việc cắt giảm lãi suất sau sự cố LTCM đã "giải phóng rất nhiều thanh khoản" và trực tiếp thúc đẩy sự tăng vọt của NASDAQ từ chiếm 11% khối lượng giao dịch trên NYSE năm 1990 lên chiếm 80% tổng vốn hóa thị trường chứng khoán năm 1999. Đợt "cắt giảm lãi suất bảo hiểm" năm 1998 này đã kích thích rất nhiều niềm tin của nhà đầu tư - giá cổ phiếu của TheGlobe.com tăng vọt hơn 600% vào ngày đầu tiên IPO vào tháng 11 năm đó, lập kỷ lục trong lịch sử Phố Wall.
Chu kỳ thắt chặt: sự kết thúc của bong bóng. Bắt đầu từ tháng 6 năm 1999, Cục Dự trữ Liên bang nhận ra nguy cơ giá tài sản quá nóng và bắt đầu chu kỳ tăng lãi suất liên tục. Trong vòng 10 tháng, Fed đã tăng lãi suất tổng cộng sáu lần, với lãi suất quỹ liên bang tăng từ khoảng 4,75% lên 6,5% vào tháng 5 năm 2000 - mức cao nhất kể từ tháng 1 năm 1991 - và lãi suất chiết khấu cũng tăng lên 6% (một trong những mức cao nhất kể từ tháng 8 năm 1991). Chuỗi hoạt động thắt chặt này đã làm tăng đáng kể chi phí đi vay, khiến các sản phẩm có thu nhập cố định như trái phiếu trở nên hấp dẫn hơn so với cổ phiếu công nghệ có rủi ro cao và các quỹ bắt đầu rút khỏi tài sản đầu cơ.
Cần nhấn mạnh rằng những thay đổi về lãi suất không làm thủng bong bóng một cách cô lập mà giống như các biến số chính trong một loạt các yếu tố xúc tác. Vào ngày 13 tháng 3 năm 2000, Nhật Bản tuyên bố nước này đã quay trở lại thời kỳ suy thoái, gây ra một đợt bán tháo toàn cầu và vào ngày 20 tháng 3, Barron's đăng một câu chuyện trang bìa "Đốt cháy" cảnh báo rằng các công ty Internet đang cạn kiệt tiền mặt, và cùng tháng đó MicroStrategy buộc phải công bố lại doanh thu do kế toán quá chặt chẽ (giá cổ phiếu giảm mạnh 62% chỉ trong một ngày). Sự kết hợp giữa lãi suất tăng + cú sốc bên ngoài + sự sụp đổ niềm tin tạo thành một chuỗi hoàn chỉnh dẫn đến vỡ bong bóng.
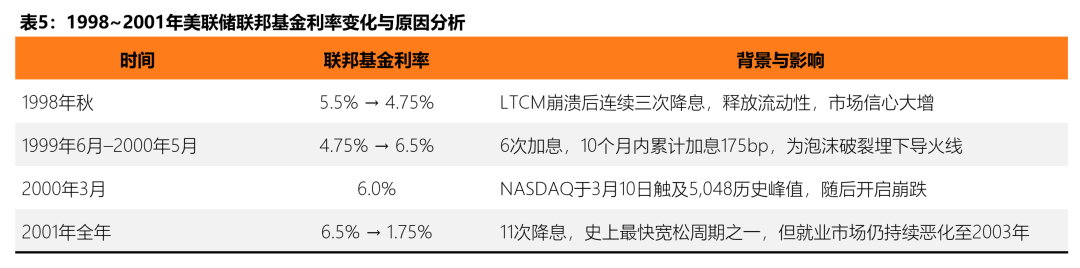
Sau khi bong bóng vỡ, Fed cũng nhanh chóng xoay chuyển. Trong suốt năm 2001, Cục Dự trữ Liên bang đã cắt giảm lãi suất tới 11 lần, hạ lãi suất quỹ liên bang từ 6,5% xuống 1,75%. Đây là một trong những chu kỳ nới lỏng nhanh nhất trong lịch sử của nó. Tuy nhiên, việc cắt giảm lãi suất mạnh mẽ đã không ngăn được tình trạng suy thoái liên tục của thị trường việc làm - tỷ lệ thất nghiệp chỉ đạt mức cao nhất là 6,3% vào tháng 6 năm 2003, ba năm sau khi bong bóng vỡ. This time lag in the transmission of monetary policy to the real economy is the key that cannot be ignored when understanding the consequences of bubbles.
Capital flood and leverage accumulation: from VC frenzy to retail leverage
If valuation indicators are the "thermometer" of the bubble and monetary policy is the "source of fire", then venture capital (VC), the IPO market and margin debt are the "fuel" that continues to accumulate in the bubble. One of the core features of the bubble expansion stage is the influx of capital into speculative assets at an increasingly faster speed and with lower and lower thresholds - from professional venture capital institutions, to IPO underwriting by investment banks, to leveraged transactions by ordinary retail investors, forming a complete speculative chain.
Venture Capital: From Picking to Sprinkling Money. Venture investment experienced explosive growth during the dot-com bubble. According to NVCA data, annual U.S. VC investments soared from about $8 billion in 1995 to a peak of about $105 billion (at current year prices) in 2000, a 13-fold increase in five years. By 1999, 39% of U.S. VC investments were in Internet companies. The direct consequence of this capital frenzy is a sharp decline in the quality of projects - a large number of startups that lack a clear path to profitability can obtain huge amounts of financing with just a domain name with a ".com" suffix.
After the bubble burst, VC funds receded like a tide. VC investment for all of 2001 plummeted to about $36.5 billion—still the third-highest year in history, but down more than 67% from the peak in 2000. Research by the CFA Institute further pointed out that the average internal rate of return (IRR) of VC funds in 1999 ended up being -4.29%, and as low as -2.51% in 2000 - that is to say, institutional funds that entered the market at the height of the bubble ended up losing money as a whole.
IPO market: from feast to frozen. The number of IPOs is one of the most sensitive indicators of market speculation. The number of U.S. IPOs reached a cycle peak of 677 in 1996. After that, it experienced a brief adjustment to 474 in 1997, 283 in 1998, and rebounded to 476 in 1999. At the end of the bubble in 2000, 380 companies were still listed. By 2001, after the bubble burst, that number had plummeted to just 80—less than a quarter of the previous year. During 1999, more than 280 VC-backed companies completed IPOs, many of which saw their share prices increase by more than 100% on their first day of listing. VA Linux soared 698% on its first day of IPO on December 9, 1999, and it remains one of the most extreme first-day IPO performances in the U.S. market.
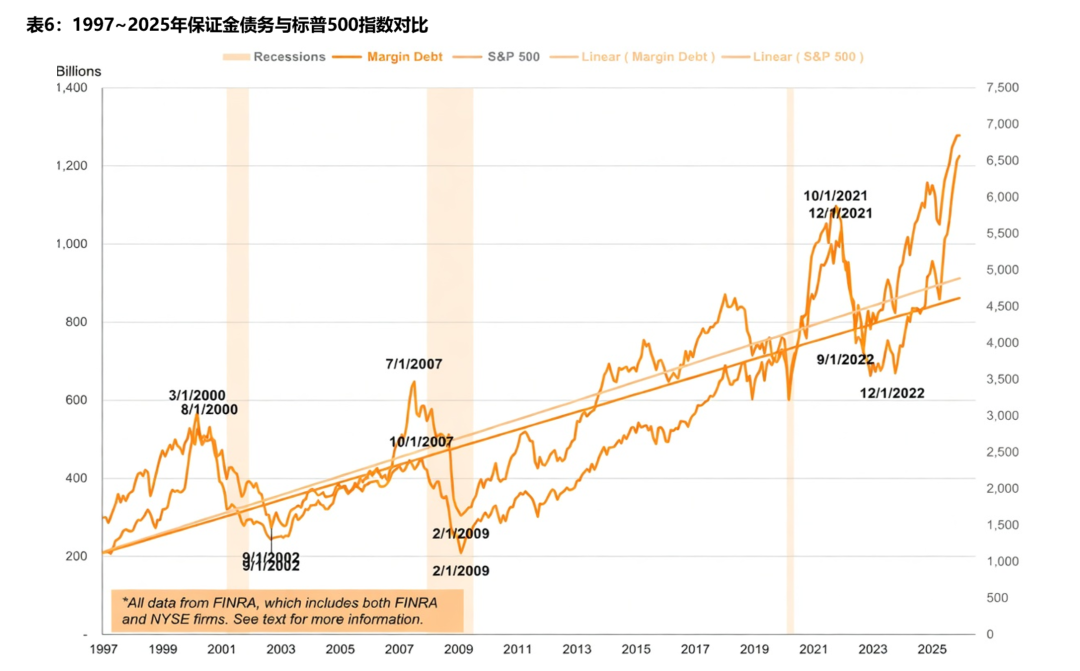
Margin Debt: Leverage peaks. That is, the market peak margin debt (margin debt) is the core indicator to measure the market leverage level and speculative sentiment. In the late 1990s, as retail investors poured into the stock market, margin debt climbed dramatically, peaking in March 2000—in line with the NASDAQ index and VC investment volume—at about $300 billion (equivalent to about $500 billion in current dollars in 2000 dollars). The ratio of margin debt to nominal GDP reached 2.6% during the dot-com bubble, a level that was approached again before the subsequent subprime mortgage crisis in 2007 (2.5%), and was significantly exceeded in 2021 (3.97%).
During the market crash in 2000, individual investors not only failed to retreat in time, but accelerated their entry. Retail investors poured a net $260 billion into the stock market in 2000, up from $150 billion in 1998 and $176 billion in 1999, data show. By the end of 2002, about 100 million individual investors had lost a cumulative market value of about $5 trillion. Vanguard research shows that by the end of 2002, 70% of 401(k) retirement accounts had lost at least 20%. This data reveals the typical behavior of retail investors in bubbles - while institutions and insiders have cashed out in large quantities, retail investors often become the last to take over.
Lagging transmission of the real economy: GDP contraction, employment collapse and jobless recovery
The impact of asset bubble bursting on the real economy is often not immediate, but gradually spreads along a transmission chain from the financial market to corporate investment and then to the labor market. Although the U.S. economic recession after the Internet bubble was mild at the GDP level, it left deep and lasting scars on employment and business investment, becoming a typical case of what economists call a "jobless recovery."
GDP: The appearance of a shallow recession and the essence of deep trauma. The U.S. National Bureau of Economic Research (NBER) defined the period from March to November 2001 as a recession, lasting approximately 8 months. At the GDP level, the recession was indeed relatively mild—real GDP shrank by only about 0.3% cumulatively, with an annualized decline of about 1.3% in the third quarter of 2001. But the GDP numbers mask deep structural wounds: Fixed investment (excluding inventories) fell continuously starting in 2001, not bottoming out until the third quarter of 2002. Real business fixed investment in the United States grew at an average annual rate of about 10% between 1996 and 2000, but this investment frenzy reversed sharply after the bubble burst—business investment fell far faster than the historical average.
Job Market: From Historical Lows to Continued Deterioration. Employment data tells a far grimmer story than GDP. The U.S. unemployment rate continued to climb from 4.0% in September to October 2000 (a 30-year low) to a peak of 6.3% in June 2003—a year and a half after the NBER deemed the end of the recession (November 2001). This unusual pattern of "recession ending but unemployment worsening" is key to understanding the legacy of the tech bubble. The U.S. Department of Labor estimates that there was a net loss of about 1.735 million jobs in 2001 and another net loss of about 508,000 in 2002. By the end of 2002, the number of unemployed people in the United States increased from about 5.6 million at the end of 2000 to about 8.4 million, an increase of 2.8 million, of which 1.7 million were long-term unemployed (more than half a year).
Employments in the technology industry bear the brunt. It is estimated that between 2001 and early 2004, approximately 200,000 jobs were lost in Silicon Valley alone. Manufacturing output fell by 7.6% from its peak in September 2000 to the end of 2001, far exceeding the 5.1% decline during the 1990–91 recession. This structural employment loss is different from previous recessions—it took an average of about 3 months to recover lost jobs after recessions and usually exceeded the previous peak in about 10–15 months. However, the full recovery of employment after the 2001 recession lasted until after 2004, becoming one of the longest employment recovery cycles since World War II.
Summary: Four-stage evolution model of bubble macro data
Based on the data analysis of the above four dimensions, we can summarize a four-stage evolution model of technology bubbles from initiation to burst from the perspective of macro indicators, which has been repeatedly verified in the railway bubble, the Great Depression of 1929 and the Internet bubble of 2000:
•The first stage: mild valuation deviation (embryonic stage). When new technologies emerge, early adopters and professional capital take the lead in deploying them. Valuation multiples are starting to exceed historical averages (e.g., CAPE breaks through 20x), but are not yet out of the explainable range. The interest rate environment is loose, the scale of VC is growing steadily, and the market sentiment is optimistic but rational.
•The second stage: Valuation accelerates (mania period). Easy monetary policy and technical narrative form a positive feedback loop. CAPE breaks through the 30x "danger threshold", and P/E and P/S show extreme values in specific sectors (such as NASDAQ P/E > 100x). VC investment has grown exponentially (annual growth rate exceeds 100%), and the number of IPOs and first-day gains have both hit historical records. Retail investors entered the market on a large scale, and margin debt soared simultaneously. Market participants began citing new frameworks to rationalize extreme valuations.
•The third stage: Valuation collapse and liquidity exhaustion (collapse period). A central bank interest rate hike or an external shock triggers the collapse of confidence. Asset prices plunged 50–80% in a matter of months. VC funds are drying up (annual decline exceeds 60%), the IPO market is frozen, and margin calls trigger a cascading effect of forced liquidations. The assets with the most extreme valuations in the bubble (unprofitable companies, conceptual projects) are the first to go to zero.
•The fourth stage: transmission of the real economy and long recovery (adjustment period). GDP has contracted modestly, but job losses have been severe and have lasted well beyond the recession itself (unemployment peaked with a lag of 2–3 years). Corporate investment has shrunk sharply, and the market has shifted from speculative growth to focusing on profits and cash flow. Regulatory frameworks are tightened ex post facto (e.g. Sarbanes-Oxley). Companies that survived, like Amazon, underwent years of revaluation and eventually became the cornerstone of a new wave of growth. Full index recovery may take 5–15 years or more.
The core insight of this model is that although the variables of each bubble are different (technical carrier, market structure, participant composition), the underlying patterns revealed by macro data are surprisingly consistent:

And this is what we will map this model to Crypto in subsequent chapters Markets can rely on a foundation of "invariants".
2. Crypto’s multiple rounds of bulls and bears: an economic trend cycle unique to the blockchain

The independent evolution of BTC: from cryptographic experiments to institutional risk assets
Most of the past bubbles have been dusted in history, and we are in the middle of the new bubble. If you have experienced multiple bull and bear cycles in Crypto, you may have the same empathy with these bubble patterns.
Therefore, in this chapter, we will use BTC as the core scale reference, BTC and the overall Crypto market as samples, and systematically analyze the similar but unique life cycle evolution path of Crypto cycles. These paths not only reflect the common laws of human speculative behavior, but also show obvious differences due to the decentralization, global immediacy and token economic characteristics of the blockchain. After the bubble, there are always some tracks that remain and become the basis of the new cycle, others are eliminated, and some complete the transformation - this is the core feature of the Crypto cycle.
On May 22, 2010, a programmer named Laszlo Hanyecz posted on the Bitcoin Talk forum, offering to exchange 10,000 Bitcoins for two Papa John’s pizzas. The deal was finalized, and he became the first person in history to use Bitcoin to purchase real-world goods. Those 10,000 BTC were only worth about $41 at the time, but are now worth over $1 billion. This event, forever commemorated as “Bitcoin Pizza Day,” vividly documented BTC’s astonishing transformation from an almost worthless technological experiment to now being regarded as a core asset by global institutions.
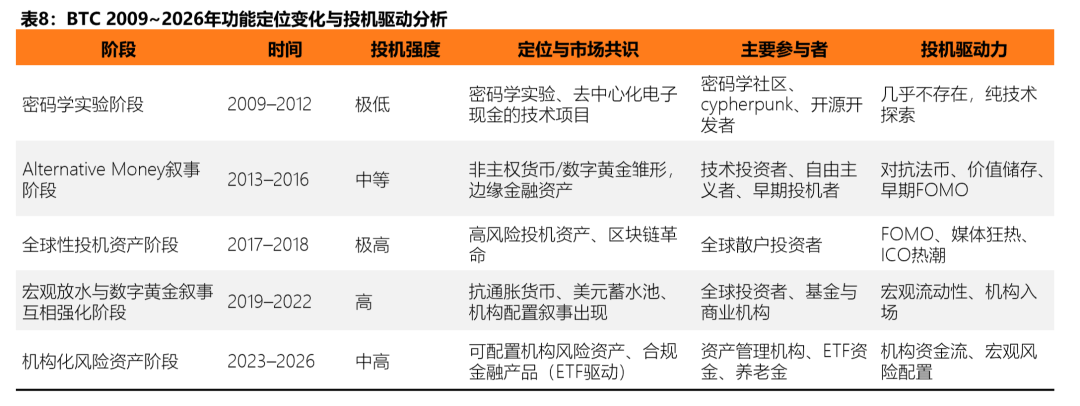
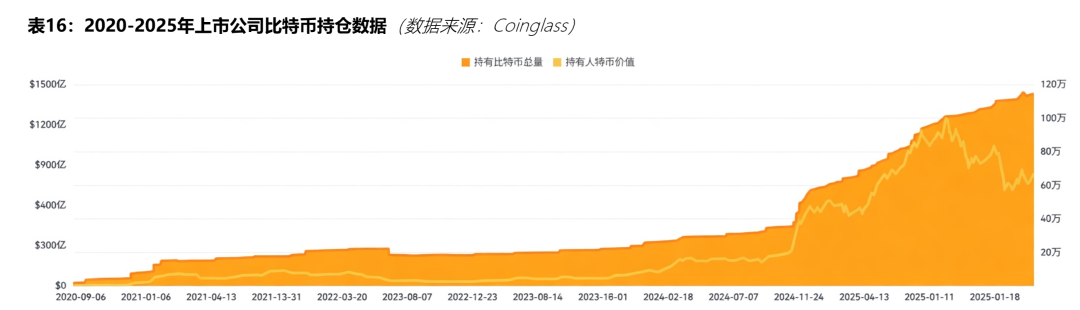
From the data point of view, the peak market capitalization growth rate of each round has gradually converged from about 88 times in 2013, while the collapse rate has dropped from 93% to about 47-48% in the 2024-2025 cycle (data as of March 2026). Behind this trend is the continued separation of the BTC and Altcoin cycles: BTC dominance will remain stable at 58.6% in 2025-2026, and the cumulative net inflow of the US spot BTC ETF since its approval in 2024 has exceeded US$55 billion (products such as BlackRock IBIT have made outstanding contributions).
This number not only far exceeds any single crypto product in history, but also directly reflects that institutions have regarded BTC as an independent allocation target rather than an accessory to Altcoin. In contrast, the overall Crypto market still maintains a high degree of speculative financial attributes:In the early stages of the bull market, the density of new narratives is high and there are many structural opportunities; in the later stages, homogeneous projects emerge in large numbers and liquidity is significantly diluted.
The vast majority of Altcoin projects quickly died or slowly exited after the bull market ended. The main reasons include the lack of real users and products, the rapid falsification of narratives, and the continued depletion of liquidity after the token price fell sharply. This pattern was most thoroughly reflected in the Terra-Luna incident in 2022: LUNA's market value once reached US$40 billion, and the core narrative "algorithmic stablecoin" was instantly falsified after UST was unanchored, and its market value returned to zero in just a few days; on-chain data shows that its TVL collapsed from a peak of US$18 billion to less than US$10 million. Since then, liquidity has dried up for a long time, and no substantial users have recovered. According to DefiLlama’s historical records, more than 70% of DeFi and Meme projects’ TVL fell by more than 90% between 2021 and 2025. Most projects entered the chronic death stage after price destruction – transaction volume continued to be low, developer activities stagnated, and were eventually completely forgotten by the market.
From 0 value to 13.6 trillion US dollars, simply sorting out the evolution of BTC, we can also have a more intuitive feeling about how its consensus value develops:
Unique Bubble Mechanism: Decentralized Speculation, Token Economy and Amplification of Network Effects
The formation mechanism of the Crypto bubble is essentially the same as the Internet bubble, but the specific manifestations are somewhat different. The latter is primarily driven by VCs, while the former is amplified through decentralized speculation, token economics, and network effects. The ICO craze in 2017 is an example of this. About US$5.3 billion was raised throughout the year. A large number of projects completed fundraising based only on white papers, and the failure rate was as high as 46-59%.
During the macro-release period of 2020-2022, the supply of stablecoins has grown rapidly from about US$5 billion to more than US$150 billion (stable at about US$310 billion in 2026), further pushing up the scale of leverage and speculation. Once external liquidity recedes, those token economies that lack a self-circulation mechanism will expose problems: high inflation design and short-term incentive dominance, and essentially rely on continuous external capital injection.
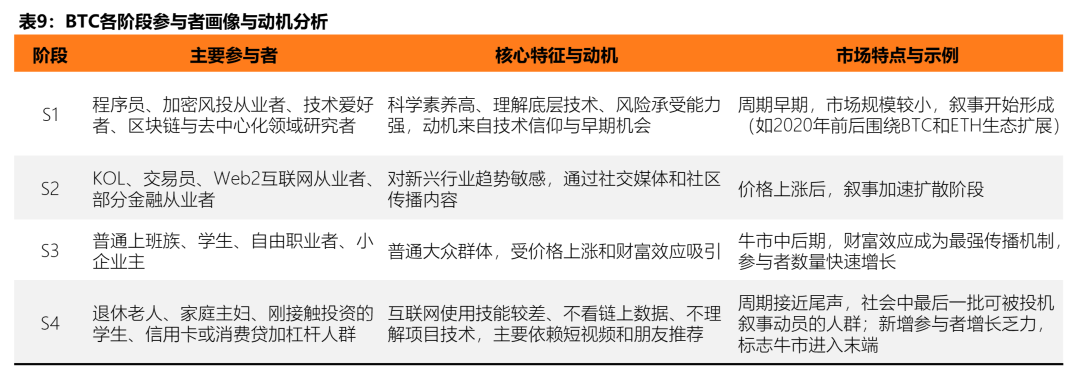
The core process of this round of Altcoin market can be explained by the diffusion of innovation theory (S-curve) proposed by Everett Rogers. The bull market is essentially a process in which speculative narratives spread from early groups to society: initially driven by innovators such as programmers, crypto VCs, and technology enthusiasts, who entered the market based on their technical beliefs; then KOLs, traders, and Web2 practitioners acted as early adopters and amplified the narrative into a phenomenon-level topic through social media; after entering the mass stage, ordinary office workers, students, and small business owners were attracted by the wealth effect and entered the market on a large scale; and finally the laggards—those with low Internet skills, mainly relying on short video recommendations, and easy to leverage—became the last wave of participants. When the adoption rate approaches the 80-90% turning point, new participants significantly decrease, marginal buying dries up, and the bull market ends. This process was prominent in the 2024 Solana Meme coin season, with more than 5,000 new tokens issued in a single month, which resulted in serious diversion of attention and funds from the same track, and the trading volume of most projects returned to zero within a few months.
When the narrative spreads to the end of society and early funds begin to realize profits, the upward price structure collapses and the bull market comes to an end. From the perspective of market behavior, the group of people in society who can be mobilized by speculative narratives have basically been absorbed, which represents the beginning of the end of prosperity.
Cycles and Cycles: Analysis of the Differences between the Internet Bubble and Crypto Bubble
In the Internet bubble, the price-to-earnings ratio of the NASDAQ Composite Index reached about 200 times at its peak in March 2000, and a large number of technology companies could not even calculate meaningful P/E (the proportion of loss-making states exceeded 50%); the median price-to-sales ratio (P/S) is as high as 32.44 times in the "Internet content" sector. Looking at Crypto, its valuation bubble is more directly reflected through the TVL/market capitalization ratio and fully diluted valuation (FDV):
The peak of DeFi TVL in 2021 is about US$180 billion, while the total Crypto market value during the same period is close to US$3 trillion, some Meme And the FDV/TVL ratio of emerging projects once exceeded 100 times. From 2021 to 2025, more than 70% of Altcoin projects still maintain high FDV after TVL has shrunk significantly, resulting in a collective failure of the valuation system, far exceeding the degree of differentiation of cash burn rates in the Internet era.
If we want to dismantle the reasons for the differences, from the structure of market participants to macro factors, we may be able to find some clues and clues.
Fundamental differences in participant structure: Grassroots victory
The Internet bubble was dominated by institutional VCs and investment banks, retail investors mainly participated indirectly through the stock market, and capital led the market. On the contrary, thanks to its decentralized underlying idea, Crypto is more directly dominated by global retail investors. The number of new addresses in the 2021 bull market has surged by tens of millions, and participants have rapidly spread from technology geeks to the end of society.
This structural difference directly amplifies volatility: Retail investors have a higher leverage usage rate (perpetual contract positions account for more than 60% all year round), causing the impact of black swan events to far exceed institutional buffers in the Internet era. A typical case is the FTX crash in 2022. The scale of market-wide leverage liquidation exceeded 20 billion US dollars, and the Altcoin sector generally fell by more than 60% in a single month.
The devastating impact of macro-tightening policies
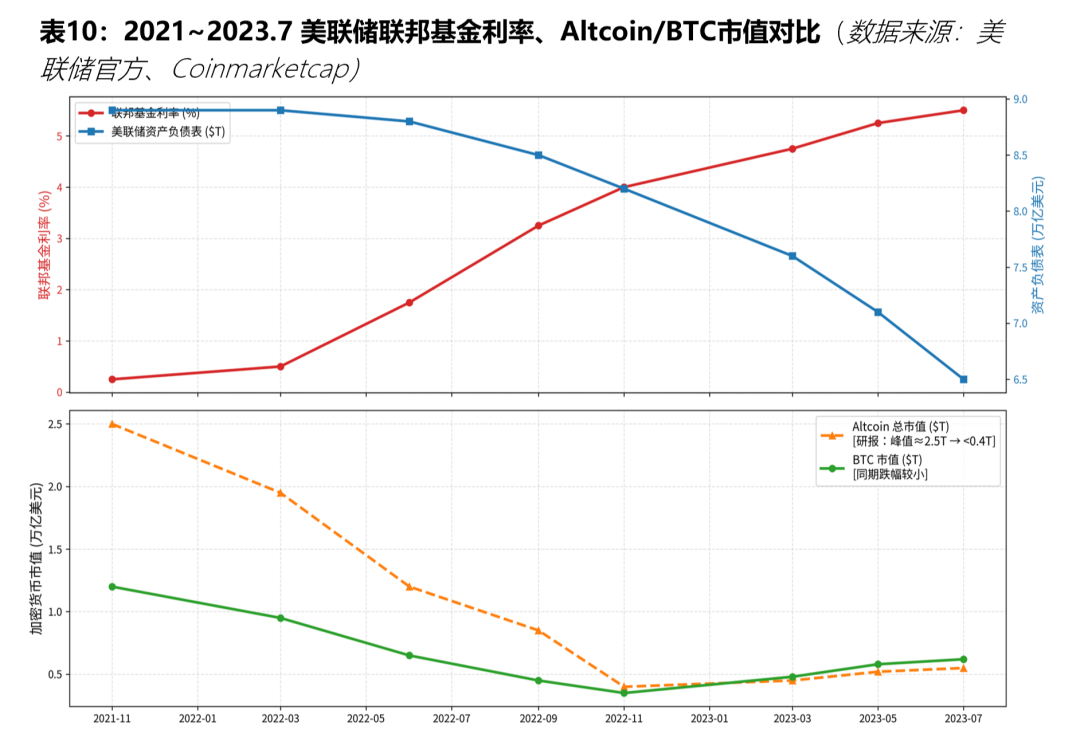
The Federal Reserve’s tightening cycle is the common terminator of both bubbles, but the blow to Crypto is more rapid and thorough. In the Internet era, the Federal Reserve raised interest rates 6 times from 1999 to 2000 (the federal funds rate rose from 4.75% to 6.5%), causing the NASDAQ to collapse by 78%; Crypto faced the most radical tightening in history in 2022: the federal funds rate soared from 0% to 5.25-5.50% (a total of 525bp). During the same period, QT was launched, and a total of about 2.4 passive withdrawals were made. trillion in liquidity (balance sheet shrank from 8.9 trillion to 6.5 trillion). Raising interest rates directly increases the opportunity cost of speculative assets, while shrinking balance sheets continues to drain the on-chain capital pool. Altcoin, which is high-beta, highly leveraged, and completely dependent on liquidity, was the first to be affected, with its total market value falling from a peak of about $2.5 trillion to less than $400 billion, far exceeding the decline of BTC over the same period.
The chain reaction of black swans and liquidity diversions
Crypto’s unique global immediacy and cross-chain characteristics allow black swans and internal liquidity diversions to form a double amplifier. In the Internet bubble, external shocks (such as the MicroStrategy accounting restatement in 2000) mainly affected a single sector; Crypto triggered a chain reaction throughout the chain after the FTX incident: a leveraged liquidation waterfall + the rapid listing of homogeneous narrative projects (solana exceeded 5,000 new tokens in a single month in 2024), resulting in severe dilution of funds in the same track, and a chronic death after the collapse of trading volume. Bear market data from 2022 to 2023 shows that Altcoin trading volume has shrunk by more than 85% from its peak, and developer activity (GitHub commit volume) continues to be sluggish, further verifying the systemic transmission of liquidity depletion.
The Liquidity Evolution of the Crypto Bubble
The rate of token issuance in the crypto market has increased exponentially, which directly dilutes the overall liquidity and makes it difficult to sustain the speculative bubble. According to observations from CoinGecko co-founder Bobby Ong, the platform currently tracks 209 chains, 1,450 DEXs, and nearly 5.5 million tokens, and new tokens are being created at an astounding rate.
He predicted that if current trends continue, the market could see about 1 billion new tokens in the next five years. This proliferation stems from the popularity of low-barrier tools, such as the pump.fun platform on Solana, which allows users to create tokens in seconds and at ultra-low cost without permission. This astronomical figure confirms that this mechanism will greatly dilute the liquidity of any meme: limited speculative funds are constantly attracted by new projects and cannot be concentrated on a single target, resulting in prosperity.
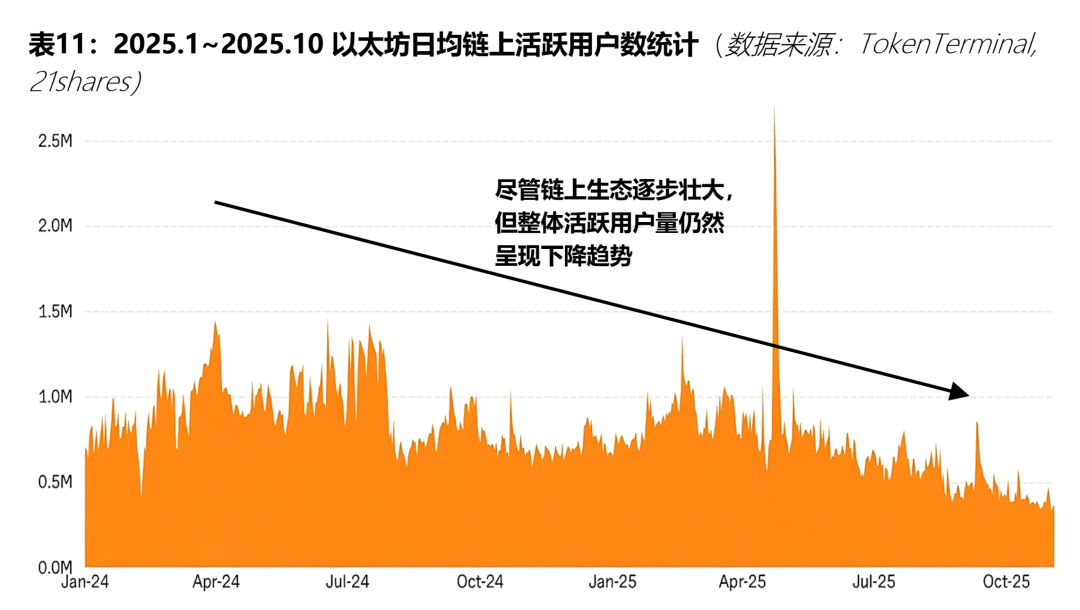
On-chain data further confirms this dilution effect. As early as a year ago, 21Shares' "State of Crypto - Market Outlook 2026" report showed that by the end of 2025, L2 activity had dropped by 61%, and the vast majority of the L2 ecosystem had become a "zombie chain". Only Base made a profit of US$55 million, while the others were deep in losses. This reflects the diversion of the proliferation of new projects: speculative funds flow from old projects to new hotspots, leading to a reduction in the size of the bubble, a drop in expectations, and ultimately an accelerated decline.
The vast majority of projects lack stable independent cash flow support - even if a few projects occasionally generate income, there are few mechanisms that can directly and efficiently transfer these income to the value of tokens (such as through repurchase, burning or dividends, etc.). In this environment, a project’s competitiveness relies almost entirely on the uniqueness and appeal of its narrative rather than the sustainability of the underlying economic model.
So in a highly speculative market structure: narrative itself is the core asset that attracts attention and liquidity. It is difficult to form a "dimension reduction attack" between projects in the same narrative track, but they lack differentiated value capture mechanisms and product technology advantages. This resulted in speculative funds being diverted repeatedly among multiple competitors, making it impossible to achieve sustained capital concentration. The result is liquidity fragmentation: attention is diluted, narrative fatigue quickly accumulates, investor expectations drop, and ultimately triggers a large-scale withdrawal of funds, pushing the entire track from prosperity to decline.
In crypto markets, a new narrative often follows a similar path:

Taking pump.fun on Ethereum L2 and Solana as examples, this mechanism is particularly obvious.
First, let’s look at the L2 narrative: around the issue of Ethereum expansion, the Rollup-centric route proposed by Vitalik Buterin lays the foundation for the narrative. The main chain is responsible for security and settlement, and L2 handles execution. The L2 narrative grabbed a lot of attention early on, driving the track to boom. However, the narratives are highly homogenous—Projects such as Optimism, Arbitrum, and zkSync all focus on expanding throughput and reducing fees, and there is no real moat. Speculative funds will naturally continue to flow away. Optimism's OP Stack further amplifies the problem: this modular architecture lowers the threshold for chain issuance, allowing developers to issue new L2s quickly and efficiently in the pipeline. The prosperity of the track coupled with the lowering of the technical threshold, L2s are springing up one after another. The result is an exponential growth in the number of L2s (1-2 in 2019, 2 in 2020, 4 in 2021, 10 in 2022, 30 in 2023) Articles, 70 articles in 2024, 140+ articles in 2025). By the end of 2025, Ethe-reum has 101 active L2s. The liquidity split has reduced the scale of the L2 token bubble in the secondary market, and the secondary market L2 narrative track has gone from prosperity to recession. At a deeper level, the proliferation of L2 will also fragment the liquidity of the on-chain ecology. L2 fragmentation increases the resistance to capital circulation and magnifies the friction and loss of funds (slippage, bridge fees, cross-ecological interactive manipulation). The experience of applications, developers and users continues to decline, and the withdrawal of users makes the liquidity on the chain increasingly depleted, which in turn strengthens the overall liquidity fragmentation problem. The fragmentation of liquidity in the secondary market and on-chain synergy leads to fragmented attention, increased narrative fatigue, and the withdrawal of speculators. The entire L2 track is in decline Small L2s have experienced a 61% TVL decline since June 2025, with projects like Blast seeing a 97% TVL collapse, down to about $55 million, while overall L2 revenue fell 53% to $130 million.
Similarly, Pump.fun, as a meme currency launch platform, embodies the ultimate form of homogeneous narrative. It simplifies token creation and allows anyone to issue tokens with one click, thereby promoting the prosperity of the Solana ecological memecoin narrative. In 2025, Pump.fun's bonding curve volumes doubled, liquidity quickly poured in, and on-chain conditions reached optimal levels. However, the mechanism of pumpfun caused meme tokens to proliferate at the speed of light, astronomical numbers of speculative targets, and the extreme dispersion of speculative liquidity completely destroyed the meme narrative track.
Looking back at the development history of the entire industry, the Crypto bubble also presents a clear four-stage evolution model, which has appeared repeatedly in the 2013 Silk Road era, 2017 ICO cycle, 2021 DeFi/NFT cycle and 2024 ETF era:
- The first stage (embryonic stage): Narratives are scarce and true, early participants enter the market, and valuations deviate slightly.
- The second stage (mania period): Positive feedback from macro liquidity and network effects, the density of new narratives surges, and the S-curve covers the masses and laggards.
- The third stage (crash period): Tightening or black swan triggers the collapse of confidence, prices fall sharply, and extreme projects are the first to return to zero.
- The fourth stage (adjustment period): Most projects slowly withdraw from the market, surviving infrastructure undergoes revaluation, and BTC’s independence is further enhanced.
In the final analysis, there is nothing new under the sun.
3. Analysis of the Internet Bubble: Four Repair Curves after the Market Collapse

Crash and Repair: How Technology Bubbles Can Correct the Market
The collapse of the bubble is also the starting point of a long repair process. After the Internet bubble burst in 2000, the macro market did not rebound as quickly as some optimists expected. Instead, it went through a multi-level, non-linear repair process that lasted nearly seven years: monetary policy took the lead, financial markets then bottomed, the real economy delayed recovery, and capital confidence was finally rebuilt. These four repair curves have different speeds and rhythms, and together they outline the complete path of how the macro market can recover to its previous level step by step after the bubble.
To understand this repair path, we cannot just be satisfied with the conclusion that "the market has finally risen back", but need to ask: How slow is the recovery speed? How expensive is it to come back? And what forces are driving this process?
This section will systematically review the entire market recovery process after the collapse of the Internet bubble in 2000 from a macro perspective, and support it with core data.
The scale of the collapse: How deep the repair begins
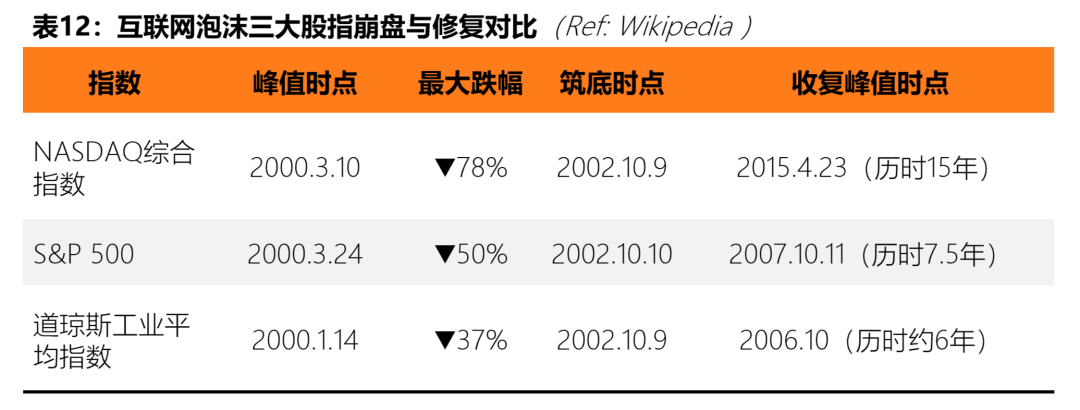
Understanding the difficulty of repair first requires an objective look at the depth of the collapse. Judging from market data, the scale of this round of damage to technology assets is one of the most tragic periods in U.S. history. Using stock index performance as a benchmark, from the peak in March 2000 to the bottom in October 2002, the NASDAQ Composite Index plummeted from 5,048.62 points to 1,114 points, a drop of 78%, almost completely erasing all the gains accumulated during the bubble period since 1995. The S&P 500 fell from an all-time intraday high of 1,552.87 points to 768.83 points during the same period, a drop of more than 50%, which although relatively mild, still represents more than 2.6 years of sustained bear market. In comparison, the Dow Jones Industrial Average suffered a maximum retracement of about 37% due to its low technology content, making it the fastest recovery among the three major indexes.
The First Repair Curve: Rapid Shift in Monetary Policy (2001-2004)
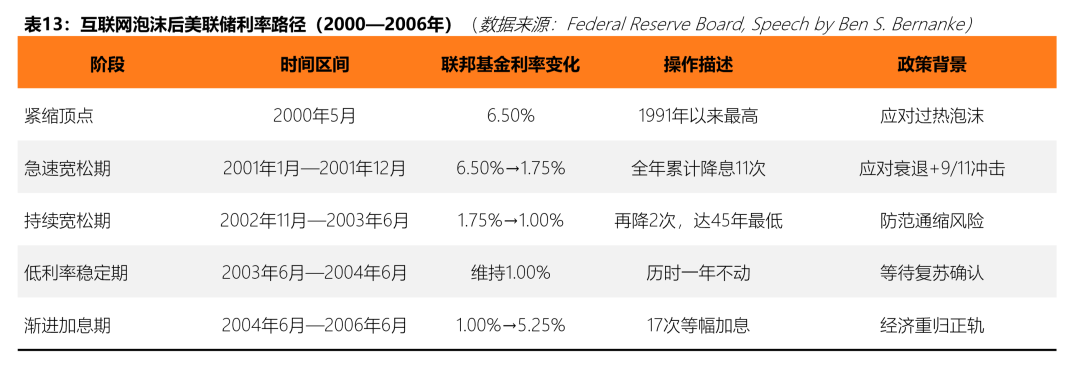
After the bubble officially burst, the Federal Reserve was the first macro force to respond. In early 2001, in the face of the stock market crash, a sharp drop in business investment, and the subsequent impact of the 9/11 terrorist attacks, the Federal Reserve cut interest rates 11 times throughout the year, significantly lowering the federal funds rate from 6.50% to 1.75%. This is one of the most intensive interest rate cuts in U.S. monetary history.
Between 2002 and 2003, the Fed continued to be easing in the context of a jobless recovery and cut interest rates twice more. In June 2003, it pushed interest rates to 1.00% - the lowest point in 45 years, and maintained it at this level for a full year. According to official research by the Federal Reserve, the core logic of this round of easing is that although the recession identified by the NBER ended in November 2001, the recovery of the job market and business investment was extremely slow, and a substantial economic recovery has been delayed.
In June 2004, as GDP growth accelerated and the unemployment rate began to decline, the Federal Reserve began to gradually raise interest rates by 25 basis points each time. It raised interest rates a total of 17 times between 2004 and 2006, restoring the interest rate from 1.00% to 5.25%, completing the return of monetary policy from extremely loose to normalized.
The above path shows the core characteristics of monetary policy operations in the post-bubble era: rapid easing to support the bottom, long-term low interest rates to catalyze, and gradual tightening to regulate.
The Second Repair Curve: Gradient Repair of the Real Economy (2001-2006)
Different from the rapid shift in monetary policy, the repair of the real economy is an obviously lagging and slower-paced process, which is specifically reflected in the layered recovery on the two trajectories of GDP and employment.
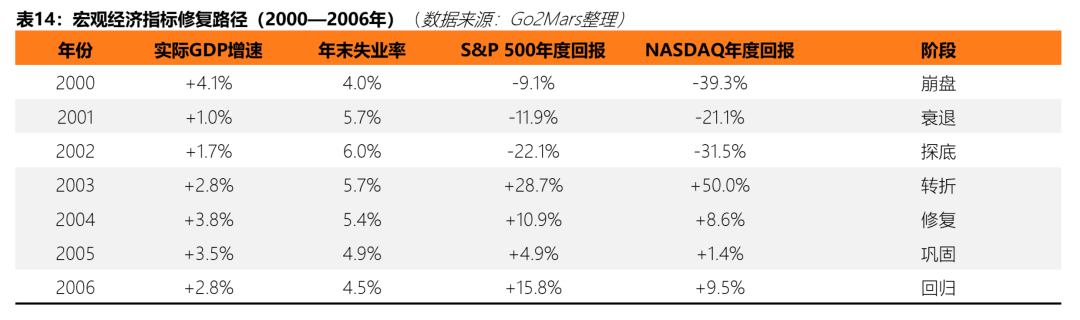
GDP level: shallow recession and gradual recovery. The NBER defines the recession from March to November 2001, which lasted only eight months and was one of the relatively short recessions in postwar history. According to BEA data, real GDP growth in 2001 was only +1.0%, which was much lower than the previous rapid expansion (+4.8% in 1999), but did not show negative growth; in 2002, driven by consumer spending and housing spending, it rebounded to +1.7%. Then, under the combined effect of loose monetary policy and fiscal stimulus, GDP growth accelerated significantly to +2.8% in 2003, and in 2004 In 2016, it reached the peak of +3.8% in the post-bubble era, showing a relatively complete form of progressive repair year by year.
The job market level: seriously lags behind GDP. Employment data is the most lagging and costly curve in this round of repairs. The U.S. unemployment rate continued to rise from a historical low of 4.0% in September to October 2000, and did not reach a peak of 6.3% until June 2003—more than a year and a half after the end of the recession. This abnormal pattern of "the recession is over but the unemployment rate is still rising" is called a "jobless recovery" by economists. U.S. Department of Labor data show that there was a net loss of about 1.735 million jobs in 2001 alone, and another net loss of about 508,000 in 2002. The tech industry has borne the brunt, with Silicon Valley alone estimated to have lost about 200,000 jobs between 2001 and mid-2003. The unemployment rate did not return to nearly 2000 levels until the end of 2006 (the unemployment rate fell to 4.4-4.5%), and the entire employment repair cycle lasted more than 6 years.
The third repair curve: layered reconstruction of the capital market (2002-2015)
Different from the relatively linear repair of the real economy, the repair of the capital market presents a more complex layered structure: the public market represented by the stock market is the first to bottom out, while VC and IPO The private equity market represented by the National Capital Market lags behind more obviously, and the repair path is incomplete.
Open market: Rapid technical rebound, but it will take a long time to fully regain the lost ground. As shown in the table below, in October 2002, after the three major stock indexes reached bottom simultaneously, the market began to enter a technical rebound stage. The S&P 500 recorded a strong return of +28.7% for the entire year of 2003. Although the gains then plateaued (+10.9% in 2004, +4.9% in 2005, and +15.8% in 2006), the positive returns continued to accumulate over the years, pushing the index to break through the 2000 peak again in October 2007. It took about 7.5 years to fully recover the lost ground. In contrast, the recovery process for NASDAQ was longer: Because the overall valuation deviation of its constituent stocks was much higher than that of the S&P 500 during the bubble, the index did not finally regain its historical closing high of 5,048 points on March 10, 2000 until April 23, 2015, which took a full 15 years, and the recovery process was interrupted by the 2008 financial crisis.
It is worth noting that although it took NASDAQ 15 years to fully regain its lost ground, from the bottom in October 2002 to 2007, the index has recovered from 1,114 points to more than 2,800 points, a range increase of nearly 150%. In other words, this is an excellent contrarian window for investors who entered the market at the bottom, but for long-term investors who held technology stocks near the peak, the waiting cost of repair is measured in ten years.
Venture capital market: contraction is severe and repair is extremely slow. The VC market’s path to repair is more tortuous than the public markets. At the peak of the bubble, annual U.S. VC investment was approximately $105 billion, or 1.087% of GDP (PricewaterhouseCoopers MoneyTree Survey data). After the crash, VC funds retreated at a much faster rate than expected: investment plummeted to about $40.5 billion in 2001, and by 2002-2003, the entire industry shrank to about half of the 2001 level, and the ratio of VC investment to GDP also compressed to less than 0.2%, less than one-fifth of the peak of the bubble.
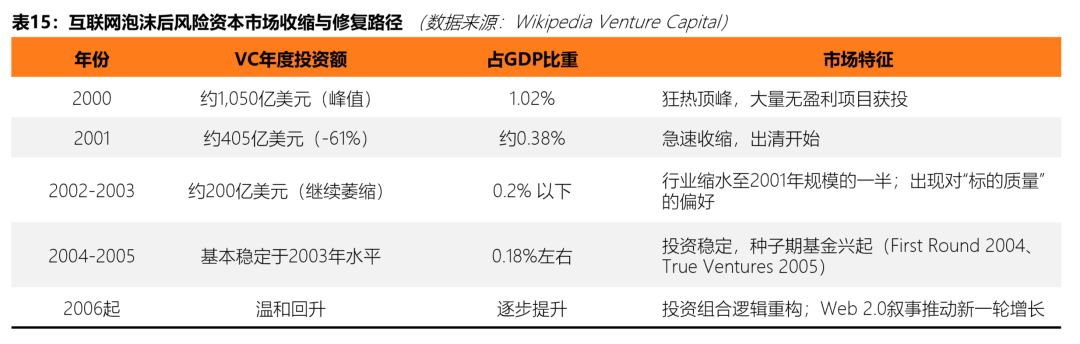
VC The microstructure of ecology also underwent fundamental reconstruction during this stage. The business model logic of “growth first, profit later” that prevailed in the bubble era was questioned, and investors began to systematically migrate to higher-quality targets—more mature companies, clearer profit paths, and lower valuation multiples became new screening criteria. According to data from Wing VC, the median age of companies that completed Series A financing increased from 0.5 years in 2000 to 1.4 years in 2003. This indicator intuitively reflects the systematic reduction in investors' tolerance for risk in start-up projects. At the same time, emerging seed-stage institutions such as Y Combinator (2005) and FirstRound Capital (2004) emerged during this period, completing the metabolism of the VC ecosystem in terms of institutional structure.
The freezing of the IPO market is also a significant feature of this period. At the end of the bubble in 2000, 380 companies were still listed; in 2001 after the bubble burst, this number plummeted to just 79, less than a quarter of the previous year. The closing of the exit window directly suppressed the liquidity of the entire venture capital ecosystem, and VC institutions fell into the dilemma of "holding positions unable to exit", further exacerbating caution in new investments. A substantial restart of this exit window will have to wait until 2004-2005.
The fourth repair curve: Reconstruction of regulatory framework and trust repair (2002-2004)
Market repair not only occurs at the valuation and funding levels, but also is reflected in the reconstruction of institutions and trust. During the Internet bubble, a large number of companies were exposed to financial fraud scandals (for example: Enron in October 2001, WorldCom in June 2002, and Adelphia in June 2002), which seriously damaged the public's basic trust in the capital market. The stock market continued to decline in 2002, in part because of a series of accounting scandals that continued to undermine investor confidence.
On July 30, 2002, the U.S. Congress officially passed the Sarbanes-Oxley Act (SOX), which is the most important regulatory reform of the U.S. securities market since the Great Depression. The SOX Act significantly strengthens the internal control requirements for public companies, increases the legal responsibility for executive financial certification, and imposes new constraints on the independence of external auditors. The introduction of this legislation marks the beginning of the restoration and reconstruction of market order at the rule level, and also provides an institutional foundation for the subsequent return of investor confidence.
At the same time, the SEC has imposed huge fines on conflicts of interest behavior at large investment banks such as Citigroup and Merrill Lynch, and has promoted structural reforms to analyst independence. These systematic system repair measures, combined with loose monetary policy and improved economic data, form a complete basis for rebuilding market trust.
Macroscopic laws of the repair path: five core conclusions
Based on the data analysis of the above four repair curves, the repair process of the macro market after the Internet bubble reveals the following regular conclusions that deserve special attention:
First, monetary policy is the fastest and most powerful lever in the repair process, but what it can mainly shorten is the bottom time of the financial market. There is still a significant lag in the transmission of employment and real investment. In this case, the peak unemployment rate occurred nearly two years after the end of the recession.
Second, there are systematic differences in the recovery speeds of different markets: the public market (stock market) is the fastest to bottom, GDP recovery is second, employment recovery is the slowest, and VC and private capital markets often experience typical excessive clearing-once funds withdraw, the reconstruction cycle will far exceed the reasonable time indicated by the crash itself.
Third, there is a huge time gap between the "formal regression" and the "substantive regression" of the index. The S&P 500 rebounded strongly by +28.7% in 2003, but its peak recovery occurred 7.5 years later; NASDAQ even took 15 years. This means that for investors who are planning at high levels, the real cycle of repair is far longer than the rebound phenomenon shown on the K-line chart.
Fourth, market repair after the bubble is often accompanied by a fundamental reconstruction of the ecological structure: the valuation logic returns from "user growth" to "profitability", VC shifts from "casting a net layout" to "selecting mature projects", and the regulatory framework shifts from "ex post facto accountability" to "systemic constraints." The restoration is not only accompanied by the return of prices, but also updates the thinking logic of participants' behavior at the entire market level.
Fifth, despite the collapse, technology companies with real infrastructure value not only survived, but also became the core engine of the next growth cycle. Amazon’s stock price fell from US$107 to US$6 during the bubble, and it was during this period that it completed its strategic transformation from e-commerce to cloud computing (the sprout of AWS), laying the foundation for its explosive growth in the subsequent decade—this was the most prophetic historical revelation during the bubble repair phase.
4. Analogy Crypto: Future Trends, Laws and Strategy Guide

Cycle positioning: What stage is Crypto currently in
As of March 2026, the total market value of the global crypto market is approximately US$2.5 trillion, and Bitcoin prices are consolidating in the range of US$65,000 to US$76,000. dominance 稳定在 58-60%左右。 This situation is highly structurally similar to the fourth stage after the bursting of the Internet bubble - the adjustment period - described above. The market has returned from the speculative frenzy, but not back to square one, but rather reorganized on a more mature foundation. Based on the data and framework of the first three parts, this chapter will map this cycle law to the current reality of the Crypto market, and propose strategic suggestions for project parties, VCs and investors.
如果将前文的四阶段模型应用于当前的 Crypto 市场,2026 年 Q2 的市场状态更接近于“调整期向进入新一轮萌芽期”的过渡地带。 This judgment is based on the following core elements.
从货币政策维度来看,美联储已于 2026 年 1 月和 3 月连续两次会议将联邦基金利率维持在 3.5%-3.75%的目标区间,最新的 FOMC 点阵图显示 2026 年仅预期一次降息。 At the same time, the energy price shock caused by the Iran war has caused inflation risks to rise again, and Cleveland Fed President Beth Hammack warned in April 2026 that if inflation remains high, the possibility of raising interest rates again cannot be ruled out. This means that the current macro environment is at the end of a tightening cycle but has not yet entered a clear easing stage. This is in contrast to what happened in 2001-2003 after the dot-com bubble burst, when interest rates were down to 1% after 13 Fed cuts and the market bottomed out in an extremely loose environment. The Crypto market is sorting out in the current environment where interest rates are still above 3.5%, indicating that the market has not yet received full support from monetary policy.
从 ETF 与机构资金的维度来看,美国现货 Bitcoin ETF 自 2024 年 1 月获批以来累计净流入已突破 530 亿美元,远超分析师在产品上线前的最乐观预期。 The current AUM of spot Bitcoin ETFs is in the range of 90 billion to 100 billion US dollars, and BlackRock’s iShares Bitcoin Trust (IBIT) alone occupies more than 45% of the market share. This trend shows that Bitcoin has begun to transform from a speculative asset to an institutional-level allocation target. Multiple sources also know that institutional investors currently account for more than 30% of all spot BTC ETF holdings.
从资本市场的结构来看,Crypto VC 市场正在经历一场与互联网泡沫后的 VC 市场高度类似的结构性调整。 According to data from The Block, the total venture capital investment in the Crypto field in 2025 will be approximately US$18.9 billion (traditional venture capital part, excluding DAT companies), which has rebounded from US$13.8 billion in 2024, but the number of transactions has dropped by approximately 60% year-on-year, from more than 2,900 in 2024 to approximately 1,200. Capital is highly concentrated in a small number of late-stage projects, and early-stage entrepreneurs are experiencing the most difficult financing environment in years. This mirrors the “quality migration” in the VC industry from 2002 to 2004 after the dot-com bubble – at the peak of the bubble in 2000, the median age of companies completing Series A financing was only 0.5 years, which had grown to 1.4 years in 2003 – as investors’ risk tolerance for early-stage projects systematically decreased.
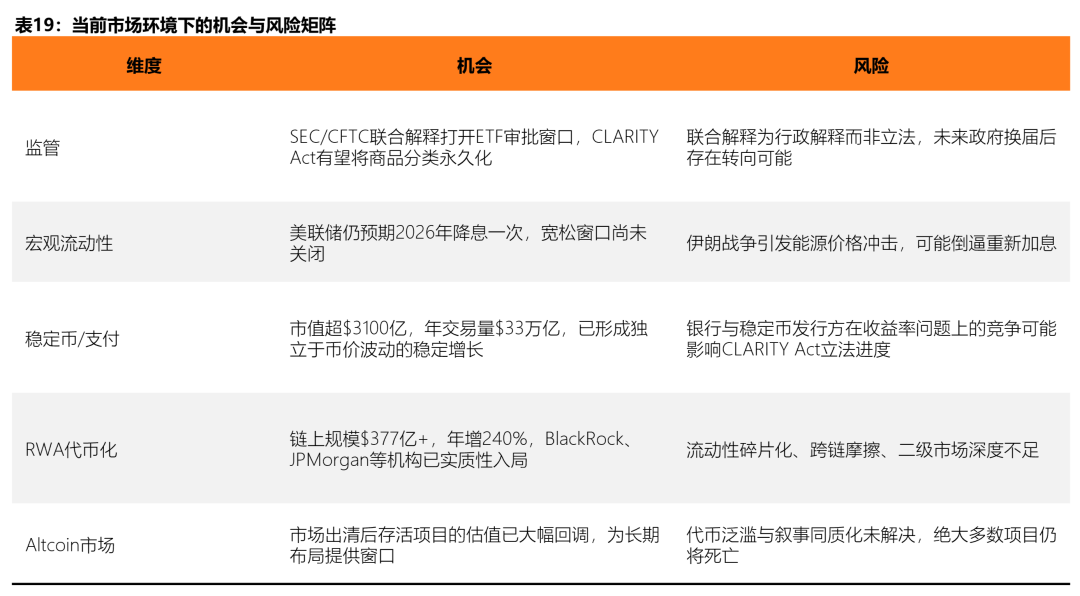
核心变量:这一次有什么不同
2026 年 3 月 17 日,美国 SEC 与 CFTC 联合发布了一份 68 页的解释性文件(Interpretive Release No. 33-11412),正式将 16 种主要数字资产归类为数字商品。 This document establishes a five-category token classification system: digital commodities, digital collectibles, digital tools, stablecoins and digital securities. Only the last category falls under the regulatory scope of the SEC, and the rest do not fall under securities laws.
这一举措的意义在于,它结束了十多年以来加密行业最大的监管不确定性。 The SEC has previously launched enforcement actions against Solana, XRP and other assets, causing a large number of institutional funds to wait and see due to compliance risks.这与互联网泡沫后 2002 年 SOX 法案的作用完全一致——当时安然、世通等财务造假丑闻严重损害了市场信任,SOX 法案通过强化内控和审计独立性重建了制度基础。 Crypto’s regulatory framework is accomplishing the same function. At the same time, the GENIUS Act was officially signed into law in July 2025, establishing a federal-level regulatory framework for stablecoins; the CLARITY Act was passed by the House of Representatives with a vote of 294-134, and was advanced by the Senate Agriculture Committee in January 2026, pending consideration by the Senate Banking Committee.

战略指南:项目方、VC 与投资者的行动框架
将互联网泡沫后的修复曲线与 Crypto 当前的市场结构进行叠加,可以得出一些关于未来五年的合理推演。
在短期(2026-2027 年),市场将继续处于整理与筛选阶段。美联储的利率路径是决定性变量:
- 如果利率在年内开始下行,风险资产将获得明确的流动性支撑;
- 如果因能源价格冲击导致通胀反复而重新加息,Altcoin 市场将面临更深层次的出清。
在中期(2027-2029 年),如果利率周期正常化并开始进入宽松阶段,Crypto 市场有可能在这一时期进入新一轮的增长周期。但与此前周期不同的是,推动这一轮增长的核心力量很可能不再是纯投机性的流动性浪潮,而是 RWA 代币化的规模化、稳定币支付的全球渗透以及机构资金通过 ETF 的持续流入。 This means that market volatility is likely to continue to decline, but growth will become significantly more sustainable. Just as in the repair cycle after the Internet bubble, Amazon completed its strategic transformation from e-commerce to cloud computing when its stock price fell from US$107 to about US$6, there will also be a number of projects in the Crypto industry that completed product upgrades during the current adjustment period and became the core engine of the next round of growth.
不过需要警惕的是,互联网泡沫的历史明确告诉我们,即便市场整体开始回暖,不同指标的修复速度存在巨大差异。 The S&P 500 rebounded strongly in 2003, +28.7%, but it took the NASDAQ 15 years to get back to its 2000 peak. In the Crypto world, this means that BTC will be repaired significantly faster than the vast majority of Altcoins, and a large number of projects that were blown away by narrative alone in the last cycle will not come back.
面向项目方:市场需要什么样的项目
当前环境下,项目方的融资背景已经发生深度变革。 a16z crypto 普通合伙人 Arianna Simpson 指出:2025 年的融资集中度主要由稳定币和支付赛道驱动,Crypto 与 Fintech 的边界正在快速模糊,基于交易费和流量的传统商业模式正在取代代币经济学驱动的旧模式。
回看互联网泡沫后的历史,泡沫破灭后存活下来并在后续十年持续增长的项目,均具备一个共同特点:它们在市场调整期完成了商业模式的根本性转型,从依赖外部资本注入转向自我维持的现金流。 For the Crypto project side, this means that "compliance + institutional level" has become the core of the future, and the focus needs to be on the following three directions: First, stablecoins and payment infrastructure, which are currently the most stable sources of income; second, RWA tokenization services, including issuance platforms, custody, compliance, and secondary market transactions; third, compliant institutional-level on-chain financial infrastructure, including clearing, settlement, and custody services.
当然值得一提的是,当下 AI 热潮中,AI 也必定会成为各行各业的关注焦点。 But for Web3 project owners, it should be more pragmatic: if AI can truly strengthen the core product logic - improve compliance efficiency, optimize risk control, or empower chain interactions - then it is worth in-depth integration; if it is just a hot-button piece of "AI + Web3" concept, it may only dilute the strategic focus and not play a substantial role in crossing the cycle.
面向 VC:如何转型
当前 Crypto VC 行业正在经历与互联网泡沫后相同的结构性重组。据 Messari 数据,截至 2026 年 3 月的过去 12 个月里,加密融资总额同比增长约 50%,但交易数量下降 46%,平均交易规模从约 900 万美元飙升至 3400 万美元。 The number of active investors fell 34.5% year over year. Dragonfly general partner Rob Hadick pointed out that many Crypto VC institutions are approaching the end of the deployment of previous funds, and the difficulty of raising new funds has increased significantly. This situation is highly similar to the restructuring of the US VC ecosystem from 2002 to 2005. At that time, new seed-stage institutions such as Y Combinator (2005) and First Round Capital (2004) were established in the deepest winter of the industry, completing the development and growth of the VC ecosystem.
基于此背景,对于当前的 Crypto VC 而言,几个关键转型方向值得关注:首先是从纯代币投资转向股权+代币的混合模式,这在稳定币、支付和 RWA 赛道中已经成为主流;其次是提高对被投项目财务健康度的要求,关注真实收入、单位经济和客户留存,而非仅仅是 TVL 或地址数;最后是地域分布的调整,从关注单纯的从单纯跟随美国市场的资金节奏,转向真正的全球化布局——特别是将亚、非、拉美等新兴市场国家同时纳入考虑范围。
面向投资者:风险识别与配置策略
历史数据反复证明,在泡沫破灭后的调整期入场,是长期回报率最高的窗口。 From its bottom in October 2002 through 2007, the NASDAQ had a range gain of over 150% (about 155%). For Crypto investors, the core strategy at this stage should include the following aspects.
首先是对 BTC 的配置优先级。 The institutionalization process of BTC is irreversible, and the existence of ETF makes the support strength at the bottom of BTC price far exceed that of any previous cycle. As of April 2026, BTC dominance remains at a level of 57-59%. This figure shows that funds are still concentrated in BTC during the overall market consolidation period.
其次是对 Altcoin 市场保持极度审慎。 The previous analysis has fully demonstrated that the proliferation of tokens and homogeneous narratives are the structural reasons for the last round of Altcoin market decline. Against the backdrop of the single-day peak of new token issuance in the Solana ecosystem exceeding 50,000 in 2024, the transaction volume of the vast majority of Meme and narrative-driven projects has returned to zero within months. Only those Altcoin projects with verifiable revenue streams and user stickiness deserve serious consideration at this stage.
最后是对宏观风险的持续跟踪。当前最大的不确定性来自两个方面:其一是伊朗冲突引发的能源价格冲击及其对通胀和货币政策的影响;其二是美联储主席的更迭——Jerome Powell 的任期将于 2026 年 5 月 15 日到期,新主席的政策倾向将直接影响后续的利率路径。 The history of the Internet bubble tells us that interest rate changes do not pierce or drive the market in isolation, but are more the result of the superposition of external shocks and changes in confidence. Investors should monitor the co-evolution of all three variables rather than rely on any one alone.
后记
历史上每一次重大技术浪潮的调整期,回望时都显得格外清晰,但身处其中时几乎没有人能够确认底部在哪里、转折点何时到来。 This is a true reflection of the current situation in the Crypto market.
从结构性指标来看,本轮调整期与互联网泡沫破灭后的修复阶段之间存在明显的历史相似性:资本向头部集中、基础设施建设持续推进、监管框架从模糊走向清晰、机构资金开始系统性入场。 These signals also appeared during the Internet's 2002-2004 period, and the end of that phase was followed by continued growth in the following decade.
但需要承认的是,Crypto 面临若干互联网时代并不存在的独特变量。地缘政治冲突对能源价格与通胀路径的直接影响,主权国家之间在数字资产监管立场上的持续分歧,以及 AI 浪潮对风险资本注意力与资源的持续抽离,均构成互联网历史类比框架之外的额外不确定性。 There is no mature historical pricing model to refer to for these variables, and they can only be dynamically adjusted through continuous tracking.
因此,对于 Crypto 市场的长期前景,审慎的乐观是合理的立场——乐观来自于基本面的结构性改善,审慎来自于上述变量的客观存在。 Before macro conditions have fully normalized, keeping a distance from all grand narratives about "super cycles" and focusing on verifiable data and quantifiable risks may be the most pragmatic and reliable principle of action at the moment.
人类是一种自欺欺人的生物,虽然我们都知道答案,但我们还是需要通过各种外部的证据,甚至于他人的肯定或否定来明确这个答案是否存在,是否正确。
泡沫之后,不是结束,而是真正的开始。
