
IOSG: BITCOIN, ETF, HOW MUCH MONEY IS REAL

@IOSG
Original link: https://mp.weixin.qq.com/s/LQgyu94-RGJ7ovYG7l-H6g
Statement: For the purpose of reproduction, readers can obtain more information by linking to the original language. If the author has any objection to the reproduction, please contact us and we will proceed with the modifications requested by the author. Reproduction for information-sharing purposes only does not constitute any investment proposal and does not represent the views and positions of Wu。
TL;DR
- ON A WEEK-BY-WEEK BASIS, ETF FLOWS ARE DRIVEN MAINLY BY A HIDDEN ARBITRAGE, NOT BY FAITH。Cash-and-carry traders buy ETFs while making empty futures at CMEs against price risk, but cannot be distinguished from real multiples in data. About half of the weekly flow fluctuates, which can be explained by the first of the new futures available from hedge funds, which are as relevant as 0.70。
- The drop in bitcoin in the week could hardly explain the financial flow。ETF FLOWS ARE PROJECTED WITH PRICE RETURNS, WITH STATISTICALLY SIMILAR RESULTS TO ZERO. THE WEEKLY FUNDS DO NOT FOLLOW PRICE PERFORMANCE, BUT GO HAND IN HAND WITH A HEDGED INTEREST RATE TRANSACTION。
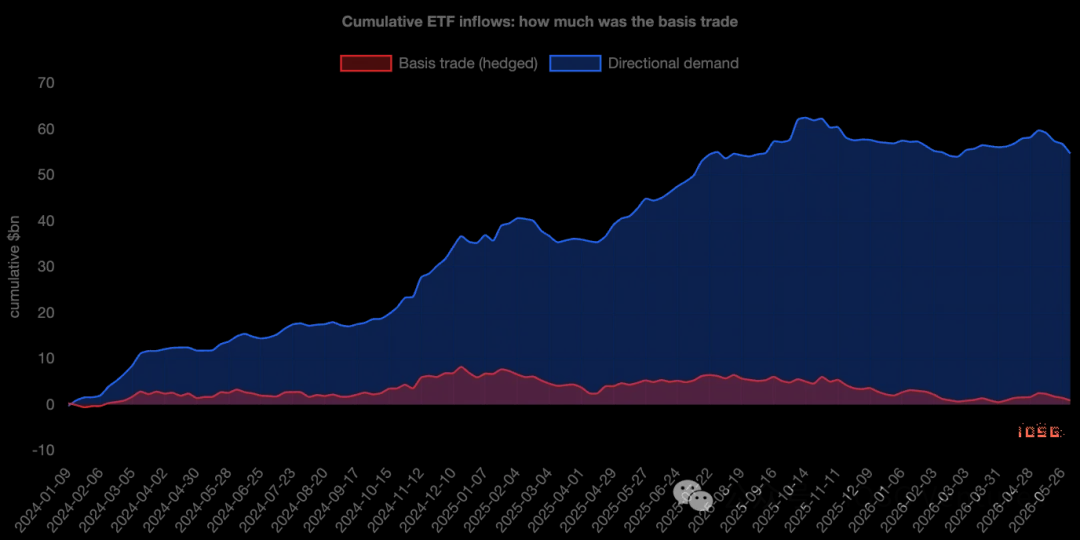
- The arbitrage is dominated by week-by-week “volatilities”, but never by “stocks”。OF THE ESTIMATED $55 BILLION IN CUMULATIVE ETF INFLOWS, THE NET ARBITRAGE TRANSACTIONS CURRENTLY ACCOUNT FOR ONLY ABOUT $1 BILLION; THE BALANCE IS A STABLE, DIRECTIONAL BUYOUT OF ABOUT $400 MILLION PER WEEK, WITH A TWO-YEAR RECOVERY CONSTITUTING ALMOST ALL OF THE “MOUNTAINS”。
- IT IS CORRECT TO SAY THAT THE ETF'S OVERESTIMATION OF FINANCIAL FLOWS IS THE “VOLATILITY” OF FAITH, NOT ITS “LEVEL”。Most of the weekly ups and downs are “rented” — arbitrage capital comes and goes; and the assets that actually sink are mostly “owned”。
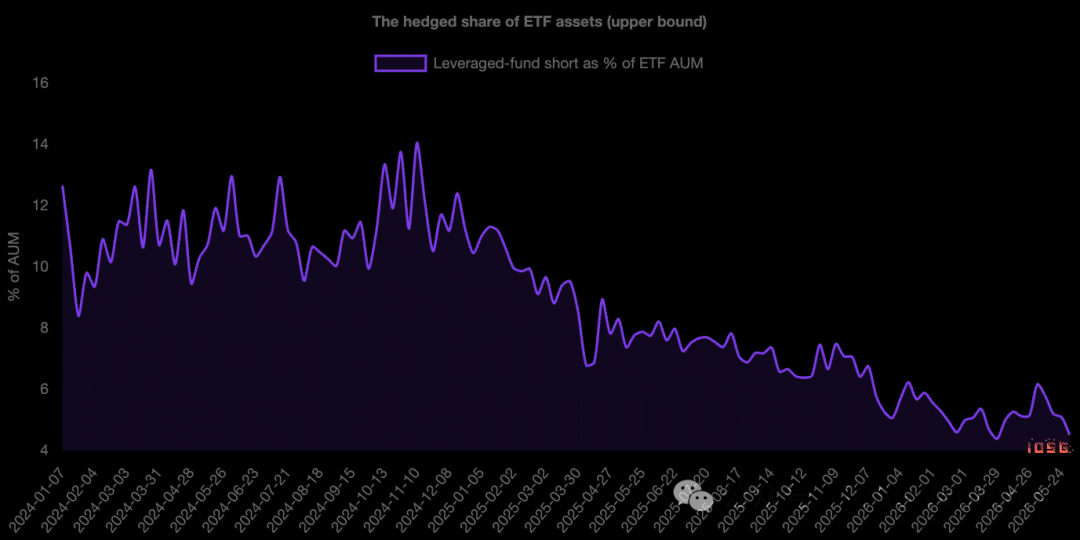
- The transaction is leaving the premises and has lasted for two years。Leverage funds have been emptying their positions from about $3 billion at the time of issuance to about $14 billion at the end of 2024, then steadily falling back to about $4.5 billion. Once the base spread is condensed to zero profit, capital inflows recede at the same time as empty — and do not misread the resulting outflows as market coins。
I. The number everyone's staring at
EVERY WEEK, BITCOIN ETF ANNOUNCES HOW MUCH MONEY GOES IN OR OUT, A FIGURE THAT IS OFTEN JUDGED ON PAPER. LARGE INFLOWS MEAN AN INFLUX OF INSTITUTIONS; OUTFLOWS MEAN A WAVE OF CONFIDENCE. DATA ON FINANCIAL FLOWS HAVE BECOME THE LEADING INDICATOR OF FAITH IN THE MARKET。
The problem is:NOT ALL THOSE WHO BUY ETFS ARE IN JAIL FOR BITCOIN。Some of the largest buyers do not care where the price goes — once they are taken into account, the weekly financial flow figures measure more their activities than anyone's beliefs. To understand the reasons, one has to know a very different kind of buyer。
A buyer who doesn't care about the price
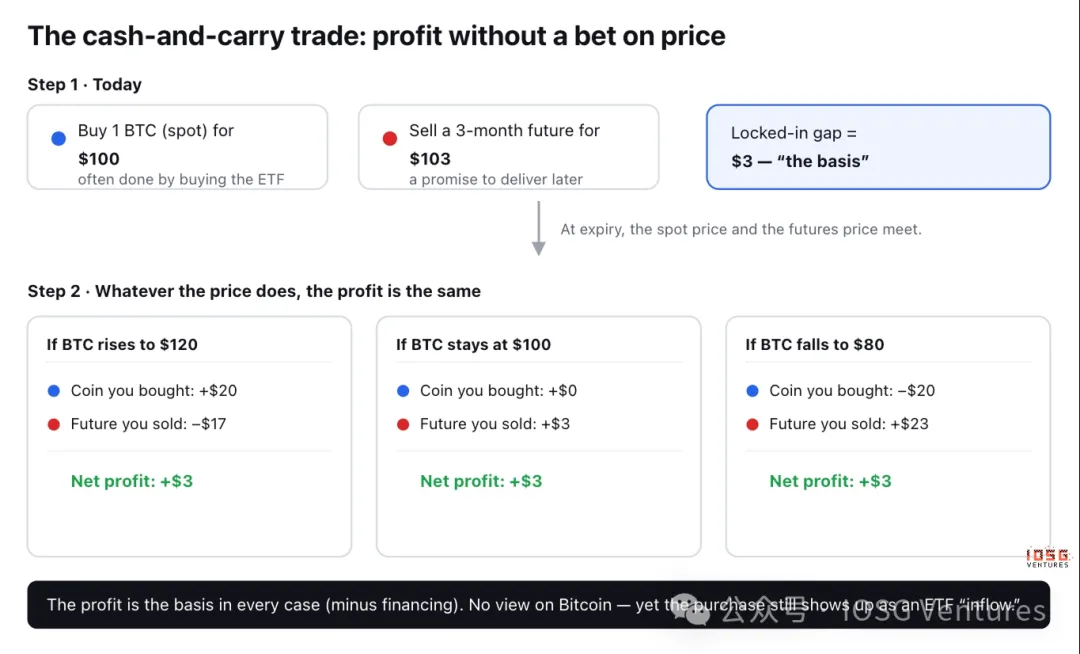
There's a classic and boring deal calledCurrent arbitrage(cash-and-carry). bitcoin's "futures" is just a contract to buy and sell bitcoin at an agreed price one day, and most of the time, the futures price is slightly higherHigherCurrent spot price - Bitcoin, for example, is $100, but the contract that expires three months later is $103。
Dealers can take no view of the price and put the difference of $3 in the bag:
- Buy1 BITCOIN, $100 TODAY (OFTEN THROUGH THE PURCHASE OF ETF)。
- SellFutures, at a price of $103, promised to be delivered in three months。
See what happens when it's due. If the bitcoin goes up to $120, the dealer earns $20 in the currency, but loses $17 in the contract -- $3 net. If you fall to $80, you lose $20, you get $23 on the contract -- or you get $3 net. If you don't move, it's still $3。In either case, profits are the same。the direction was crossed and the dealer called it "delta neutral". this is the difference of $3.00, expressed by yearbase differences (basis)— It is essentially an interest rate earned by traders who keep money in the transaction; it is worth doing as long as it is higher than the risk-free gain that would accrue to T-bil。
Why would it contaminate the headline
The key here. First leg -Buy 1 bitcoinIT'S VERY COMMON TO BUY ETF. AND SOA trader with little idea of the bitcoin, who is neutral about delta, shows an ETF inflow in dataOn the face of it is no different from true believers。
When large amounts of current arbitrage were created, the flow seemed strong, and the story of the “agency is stowing up” came true - While these funds are running out of course, once the transaction is no longer profitable, they reverse immediately. In other words, the financial flow figures measure more than faithIt measures the dynamism of the arbitrage counter。The question is how to separate them — and how big they are。
How do you distinguish between the two
Current arbitrage traders will staySecond footprintI DON'T KNOW. EACH TIME THEY BUY A BITCOIN WORTH $1 THEY MAKE AN EMPTY ONE-DOLLAR FUTURES ON CME. THE TRUE BELIEVERS LEAVE ONLY THE FIRST FOOTPRINT; THE ARBITRAGERS BOTH LEAVE BEHIND。
AND THE SECOND FOOTPRINT IS PUBLIC. THE UNITED STATES DERIVATIVES REGULATORS ISSUE WEEKLY REPORTS ON THE SIZE OF THE MULTIPLICITY OF TRADERS ON CME. ONE OF THEM -leveraged fundsIN ESSENCE, IT IS HEDGE FUNDS — WHERE THE CURRENT ARBITRAGE GROUPS GATHER. SO YOU CAN LINE UP THE FLOW OF FUNDS INTO THE ETFS AGAINST THE NEW EMPTY POSITIONS IN THESE FUNDS. IF “DEMAND” IS REALLY FAITH, THE TWO SHOULD NOT BE SO MUCH LINKED; IF A LARGE PART OF THIS IS THE HIDDEN DEAL, THEY SHOULD MOVE IN THE SAME DIRECTION。
ii. How does the data say: On a week-by-week basis, money flows follow futures rather than prices
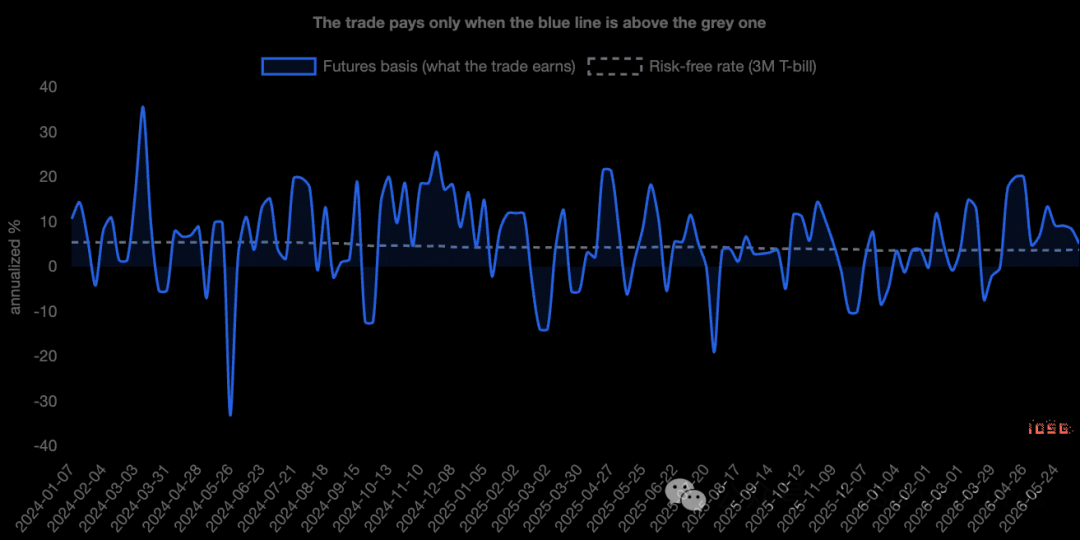
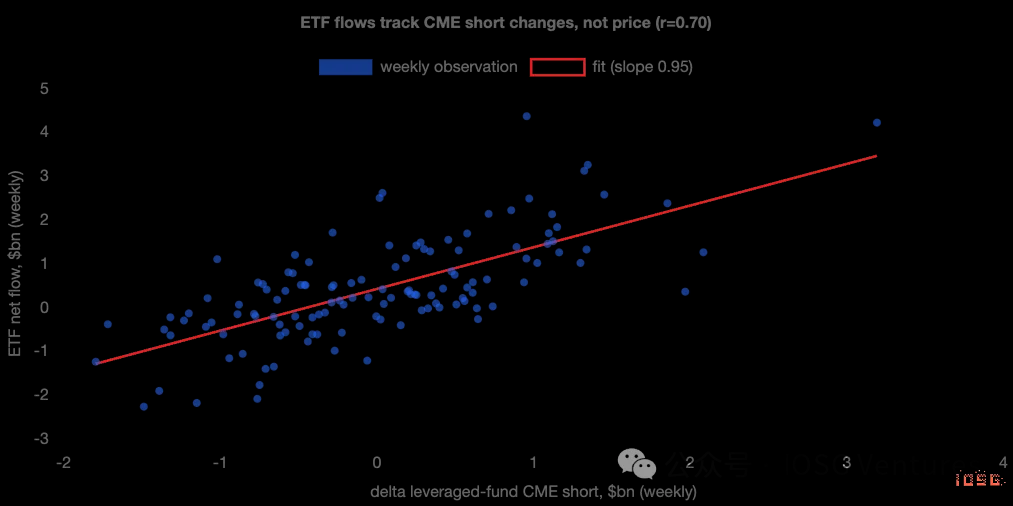
They move in the same direction。EVERY WEEK SINCE THE ETF WAS LAUNCHED, THE MORE FUTURES WERE EMPTY, THE MORE ETF INFLOWS - ALMOST ONE-ON-ONE. ABOUT HALF OF THE WEEK-BY-WEEK FLUCTUATIONS IN THE FLOW OF FUNDS CAN BE EXPLAINED BY ONLY ONE THING: HOW MUCH NEW SPACE HAS BEEN MADE BY THE FUND. THE CORRELATION IS 0.70, THE INTENSITY OF THE CORRELATION YOU SEE BETWEEN TWO THINGS THAT ARE CLEARLY RELEVANT, NOT COINCIDENCE。
The most important thing to wake up is:Prices alone can hardly be explained。THE STATISTICALLY INDISTINGUISHABLE ANSWER TO THE TEST OF WHETHER THE RETURNS ON THE WEEKBITCOIN PREDICT ETF FINANCIAL FLOWS. THE WEEKLY FUNDS ARE NOT ON TRACK; IT IS ON TRACK WITH A HEDGED INTEREST RATE TRANSACTION。
So, as aWeek by WeekSIGNAL, ETF “DEMAND” IS PRIMARILY ARBITRAGE. THE FINANCIAL FLOW FIGURE IS A POOR THERMOMETER TO MEASURE FAITH, BECAUSE IT RISES AND FALLS AS A RESULT OF THE REPEATED SWITCH ON THE BASE-SIDE TRANSACTION, AND NOT BECAUSE ANYONE HAS CHANGED THE PERCEPTION OF THE BITCOIN。
But..FundsHow many of them are this deal
It is here that the simple and harsh rhetoric — “all lies” — cannot stand, and the true story is more interesting. The basis of the trade is the week by weekVolatilityBut it never wasFundsThe subject。
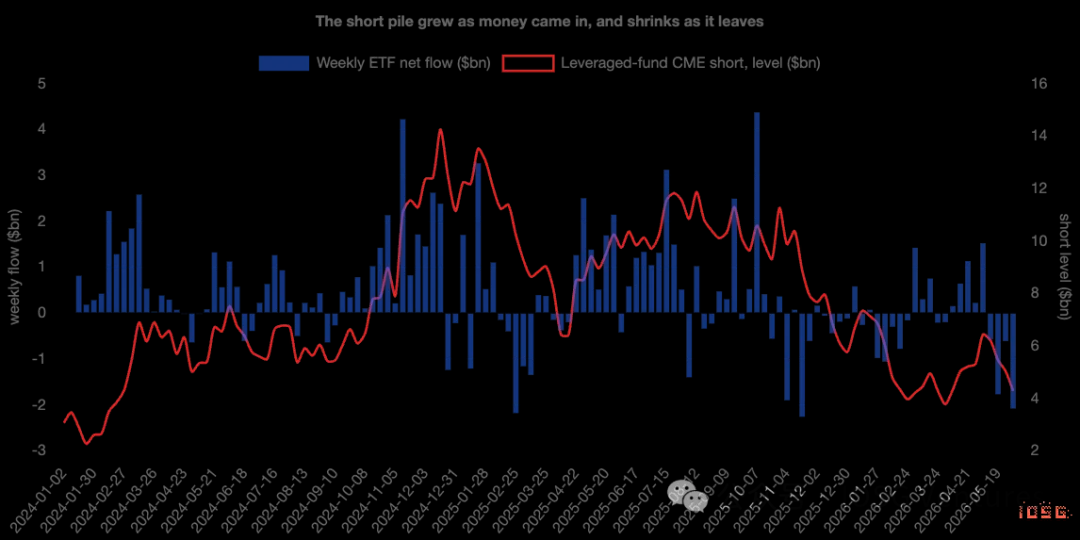
THE WEEKLY INFLOW OF FUTURES IS USED AS AN EMPTY INTERPRETATION (SHOCKING) AND THE REST (DIRECTIVE) AND ADDED UP SINCE ITS ISSUANCE. ABOUT CUMULATIVE ETF INFLOWS$55 billion,Base transactionThe current net is only about $1 billion- The rest are stable, directional purchases。The buyout is about $400 million a week, week after week, and, regardless of the basis or price, two years of return, almost the entire mountain。
Instead of capital flows, the picture is the same: the hedges are inAT ONE POINT IN 2024, 14 PER CENT OF ETF ASSETS WERE APPROACHING, NOW ABOUT 4 PER CENT TO 5 PER CENT。The peak was an unmindful minority, and it is only a small fraction today。
So, more precisely:ETF FLOWS OVERESTIMATE THE VOLATILITY OF FAITH RATHER THAN ITS LEVEL。Most of the weekly rises and falls are “rents” — arbitrage capital comes and goes; but the assets that really sink are mostly “owned”. The transaction was mixed up in financial flow data but was never the subject of the balance。
And the deal is leaving
The hedge is not only small -- it's been shrinking for two years. Leverage funds have accumulated from about $3 billion at the time of their issuance to about $14 billion at the end of 2024 and have steadily fallen to about $4.5 billion。The arbitrage has been flat throughout the zone, not just recently。
IT'S IMPORTANT FOR READING NOW. IN JUNE, THE NETTING POSITION WAS ROUGHLY HALVED — THE FUND'S EMPTY HEAD SHRUNK FROM ABOUT $6.4 BILLION TO $4.3 BILLION — WHILE THE ETF OUTFLOWS $300 TO $500 MILLION PER DAY. IT'S LIKE A PANIC SURRENDER. HOWEVER, COMBINED WITH FUTURES DATA, THIS IS ONLY A ROUTINE CLEAN-UP OF A NO LONGER PROFITABLE INTEREST RATE TRANSACTION。The same exit figures, two different stories。
When the base margin is compressed, demand recedes
THE CLEANEST PROOF IS WHAT HAPPENS WHEN THE TRANSACTION IS NO LONGER PROFITABLE. THE TRANSACTION IS NOT WORTH DOING WHEN THE DIFFERENCE OF $3 NARROWS DOWN TO THE LEVEL THAT THE DEALER CAN EARN WITHOUT RISK. IF A LARGE PART OF THE WEEKLY DEMAND IS REALLY THE DEAL, THEN THE WEEKLY DEMAND SHOULD BE JUST AS WEAK AS WHEN THE PRICE GAP IS REDUCED — AS IS THE CASE. DISSOCIATE EACH SEQUENCE FROM THE TREND AND OBSERVE THE MOMENT BEFORE AND AFTER THE COMPRESSION: ETF INFLOWS BREAK THEIR NORMAL RHYTHM, WHILE THE FUND REFILLS THE GAP, AND THE TWO OCCUR SIMULTANEOUSLY。Demand and trade with breathing。
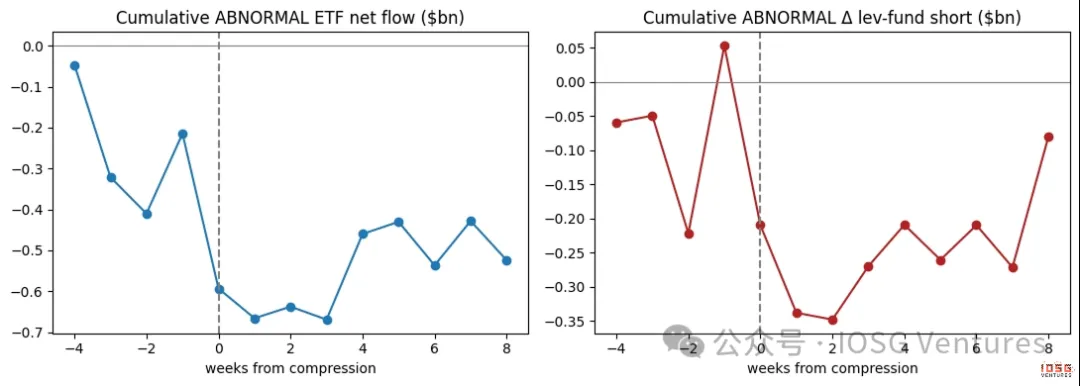
True believers don't care about futures base differences. And this weekly "demand" obviously cares。
Who's first and who's really working
First, the connection is..For the same period— the closest in the same week, with no clear lead or lag; and the only partial evidence of direction actually points toOn the contraryDIRECTION: ETF FLOWS DRIVE EMPTY, NOT VICE VERSA. THIS IS IN LINE WITH THE LOGIC OF A PAIR OF TRANSACTIONS: BUY ETFS FIRST, AND FUTURES HEDGES FOLLOW, RATHER THAN “GETTING OUT” OF FINANCIAL INFLOWS. SECONDLY, ARBITRAGE IS NOT THE ONLY DRIVER. THE FLOW OF FUNDS AND LEVERAGE FUNDS ARE THE ONES THAT KEEP UP THE MOST, BUT IT IS ALSO RESONATING WITH THE SILOS OF DIRECTED AGENCIES — BOTH BUYERS ARE ACTIVE. THE IDEA IN THIS PAPER IS NOT THAT EVERY INFLOW IS A HEDGE; IT SAYSPumping transactions are the closest and most reliable driver of week-by-week fluctuations。
Etherport: The same deal, but it's almost impossible
Applying the same tests to ETF, the features are still present, but they are weaker - the connection with empty futures is looser, and the stable directional purchase under there is close to none. The reasons are clear. Possession of the spot in the utensils rather than futures means relinquishing the pledge (staking) gains provided in the utensils, about 3 to 4 per cent per year. After deducting this part, the base difference in Taifung is oftenNegative— ARBITRAGE TRANSACTIONS OFTEN DO NOT CROSS ITS THRESHOLD GAINS AT ALL. SO ETF HAS NEITHER A STRONG FAITH BUY NOR A ROBUST ARBITRAGE; THEY'RE JUST SMALLER AND MORE MUFFLED THAN THEIR OWN KIND。
IV. FROM NOW ON, HOW TO INTERPRET ETF FLOWS
The point is not to judge prices, but to interpret financial flows. When the base is large, “institutional demand” is expected to appear strong and to a large extent to be hedged — not mistaken for faith. When the base margin is compressed, the expected inflows go back with the empty head — and do not misread the resulting outflows as market coins。The two figures worth following are: the level of annual base margin gains relative to T-bil interest rates and the net amount of funds leveraged in the weekly CME report。They'll tell you how much of the next demand headline is real。
How do we measure it
A FEW HONEST LIMITATIONS. THE DIFFERENCE IS BUILT FROM THE CME FUTURES CONTRACT OF THE LAST MONTH TO THE SPOT AND REMOVES THE LAST FEW DAYS BEFORE EACH MATURITY DATE (THE VERY SHORT MATURITY PERIOD WILL MAGNIFY THE ROUNDING ERROR INTO A FALSE TIPPING POINT); THE SEQUENCES BUILT ON A CONTRACT-BY-CONTRACT BASIS WILL MAKE THE EXACT NUMBER SHARPER, BUT WILL NOT CHANGE THE CONCLUSION. THERE'S A GOOD RELATIONSHIP BETWEEN THE FLOW OF MONEY AND THE EMPTY HEAD, NOT PROOF THAT ONE LEADS TO THE OTHER -- - THE POINT IS THAT THEY ARE HALF THE SAME DEAL. FUTURES EMPTY NUMBERS ARE THE UPPER BOUNDS OF THE OFFSET RATIO OF ETF PURCHASES, AS SOME OF THE EMPTY MATCHES ARE HELD ELSEWHERE。
NONE OF THIS CHANGES THE MAIN CAUSE. ON A WEEK-BY-WEEK BASIS, BITCOIN ETF'S “DEMAND” IS LARGELY A HIDDEN EXCHANGE OF INTEREST RATES RATHER THAN A BELIEF — THE FLOW OF FUNDS THAT MEASURES THE ARBITRAGE OF PARTICIPATION IS FAR MORE ACCURATE THAN THE BELIEF. AND THE REAL BUY IS REAL, PATIENT, AND NOW IT'S THE VAST MAJORITY OF THE REST, BECAUSE THE “RENTED” PART HAS TAKEN TWO YEARS TO GO HOME。
